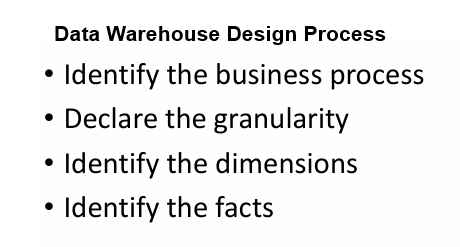
Conceptual modeling is the high-level design phase of a data warehouse, focusing on how data is organized and represented for easy querying and reporting. It helps structure data in a way that supports analytical processing and business intelligence.
Conceptual Modeling defines high level design structure / schema of Data Warehouse, how data organized, reporting & querying etc.
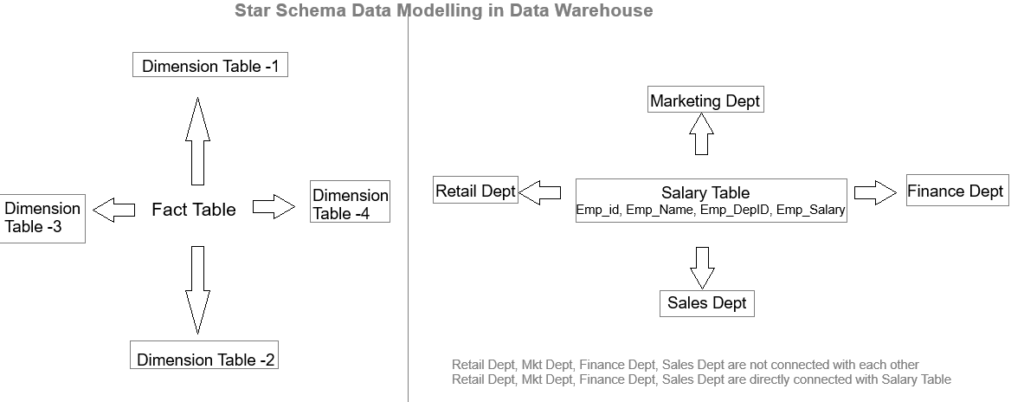
Step [1] –Star schema is a most widely used schema design in data warehousing.
Star schema Features: It’s having central fact table that holds the primary data or measures, such as sales, revenue, or quantities. The fact table is connected to multiple dimension tables, each representing different attributes or characteristics related to the data in the fact table. The dimension tables are not directly connected to each other
Star Schema easy to understand & implement & best for reporting and OLAP (Online Analytical Processing)
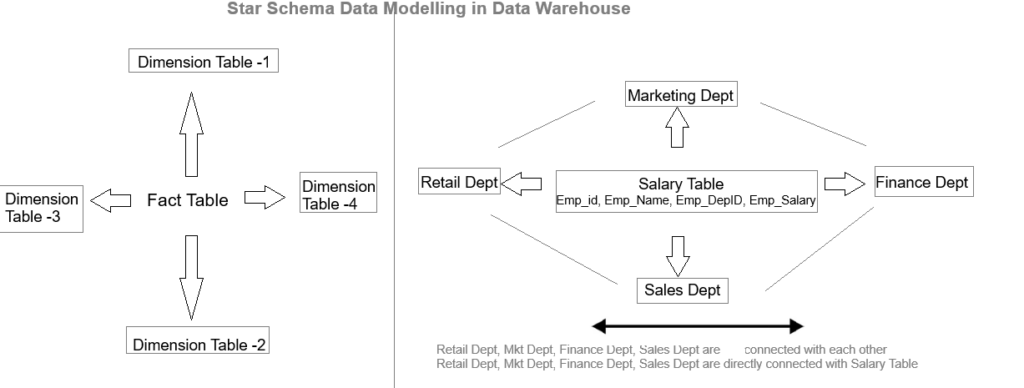
Step [2] –Snowflake Schema is a extended part of Star Schema, where dimensions tables are normalized & connected with each others.
Snowflake Schema is more complex schema where dimension tables are normalized into multiple related tables.
Snowflake Features: It’s having central fact table that holds the primary data or measures, such as sales, revenue, or quantities. The fact table is connected to multiple dimension tables, each representing different attributes or characteristics related to the data in the fact table. The dimension tables are directly connected to each other
Star Schema easy to understand & implement & best for reporting and OLAP (Online Analytical Processing)
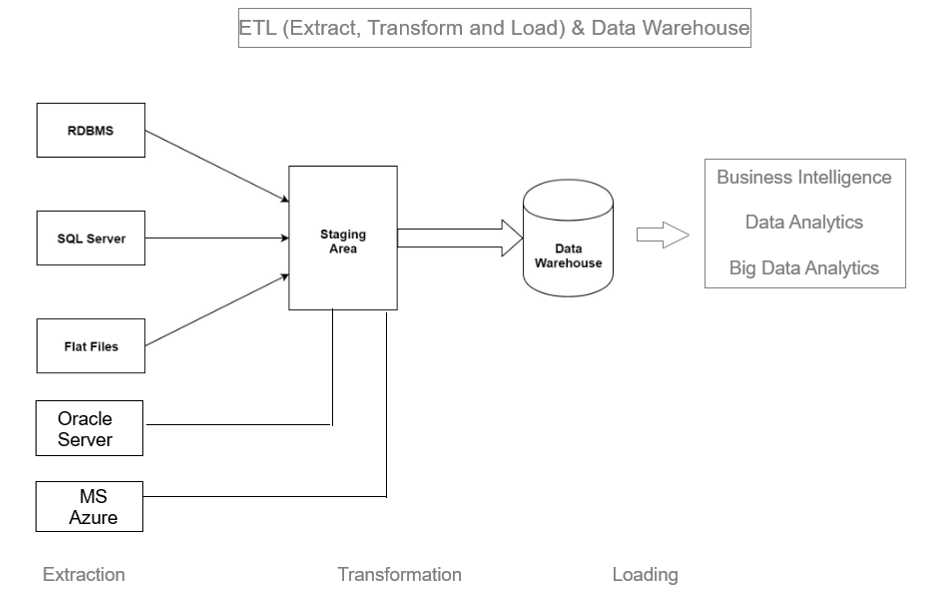
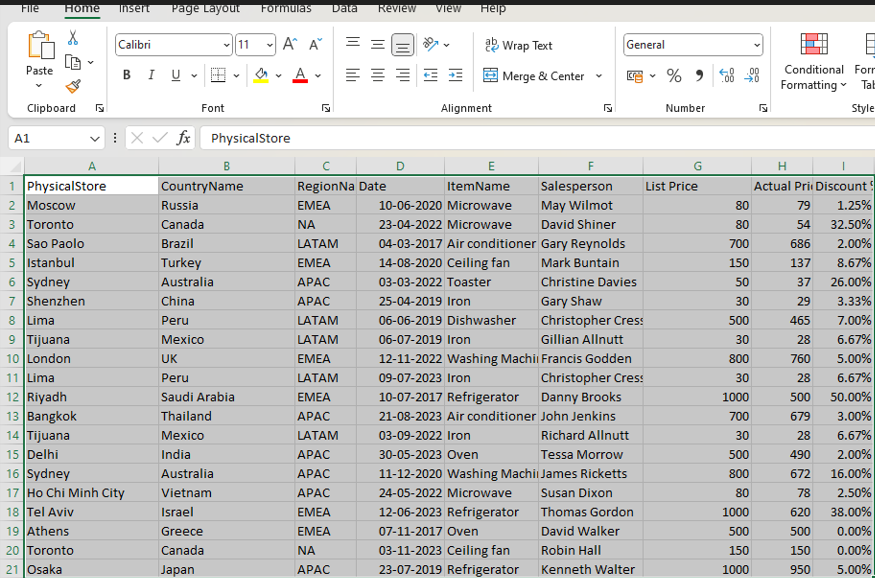
Extract, transform, and load (ETL) is the process of combining data from multiple sources into a large, central repository called a data warehouse. ETL uses a set of business rules to clean and organize raw data and prepare it for storage, Business Intelligence, Data Analytics, and Machine Learning (ML).
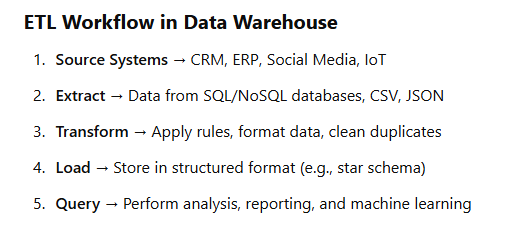
Collect raw data from various sources (databases, APIs, flat files, etc.).
Step [1]- Extract Data: ETL process is used to extract data from various sources such as transactional systems, spreadsheets, and flat files. This step involves reading data from the source systems and storing it in a staging area.
Clean, filter, and format raw data to match the data warehouse schema.
Step [2] – Transform Data: The extracted data is transformed into a format that is suitable for loading into the data warehouse. This may involve cleaning and validating the data, converting data types, combining data from multiple sources, and creating new data fields.
Store transformed data into the data warehouse for reporting and analysis.
Step [3] – Load Data: Once Data transformed, it is loaded into the data warehouse. This step included creating the physical data structures and loading the data into the warehouse.
A Temporary storage location where data is exchanged or transferred between two systems, It typically handles small transactional data in a structured format.
Definition: A small, focused subset of a data warehouse designed for a specific department or team.
Scope: Limited to a single business unit (e.g., Sales, Marketing).
Purpose: Quick access to relevant data for specific needs.
Structure: Highly structured and pre-processed.
Example:
A sales data mart containing monthly sales, customer data, and product performance for the sales department.
I a E-commerce, when a customer makes a payment , the payment gateway system exchanges transaction details with the Order Mgt System.
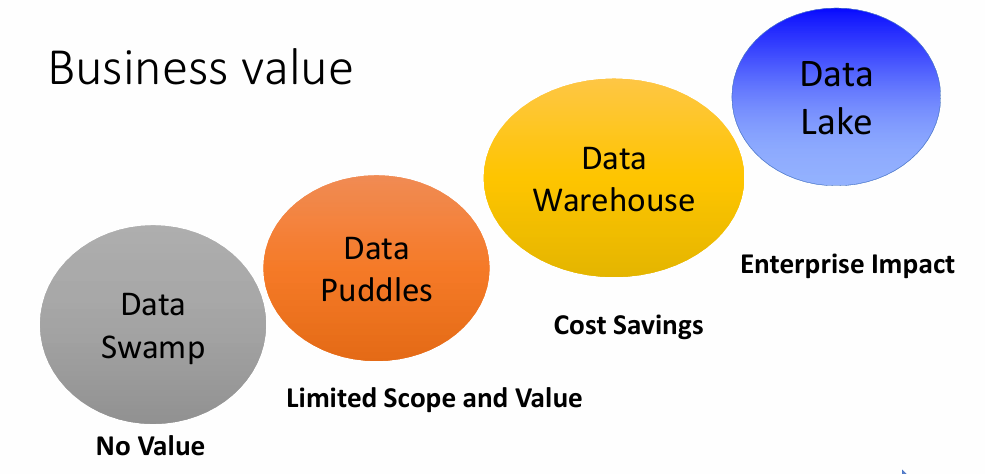
2. Data Puddles
Small, isolated collections or data typically focused on a specific department or project. These are often uncoordinated & may no follow a consistent schema.
Definition: A small-scale, isolated data repository created by individual teams for short-term use.
Scope: Project or Department specific or team-specific with minimal governance.
Purpose: Temporary storage for ad-hoc analysis or experiments.
Structure: Semi-structured or unstructured, often created for quick insights.
Example:
A marketing team’s Excel sheets and Google Drive files collecting social media metrics for a campaign.
It serves marketing specific needs but is not accessible across other departments.
3. Data Warehouse
A centralized repository of structured data that is cleaned, organized & optimized for querying & reporting. Data Warehouses support Business Intelligence(BI) & analytics by integrating data from multiple sources.
Definition: A centralized, structured repository that stores processed and organized data from multiple sources.
Scope: Enterprise-wide, integrating data from across the organization.
Purpose: Supports business intelligence (BI), reporting, and analysis.
Structure: Highly structured with defined schemas (star/snowflake schemas).
Example:
Amazon Redshift or Google BigQuery storing customer transactions, inventory, and supply chain data for reporting and forecasting.
An otg
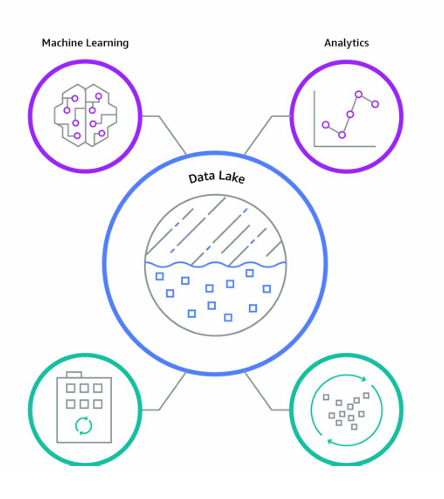
4. Data Lake
A scalable repository that stores vast amounts of data as
Structured Data Format, Unstructured Data Format, Semi Structured Data Format.
It is used for advanced analytics, machine learning & big data
Definition: A vast, unstructured repository that stores raw data from various sources in its native format.
Scope: Enterprise-wide with the ability to store massive datasets.
Purpose: Enables advanced analytics, machine learning (ML), and data discovery.
Structure: Unstructured or semi-structured; no predefined schema.
Example:
AWS S3 or Azure Data Lake storing IoT sensor data, social media feeds, and raw logs for future analysis.
An organization uses data warehouse (Snowflake or Amazon redshift) to coordinate sales, customer & financial data, It allows analysts to create dashboards & generate reports for long term business strategy.
A flowchart that visually represents the sequence of activities and decisions in a process or project. It shows the flow from one activity to another but lacks time or resource detail.
Used primarily in UML (Unified Modeling Language) for software modeling.
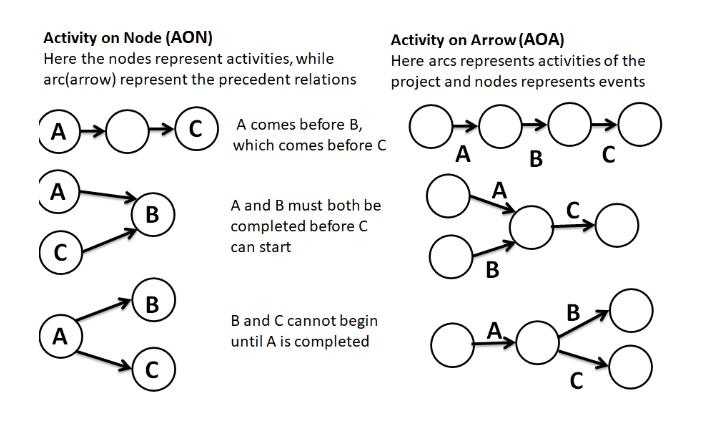
Step-2:Network Diagram:
A graphical representation of a project’s activities and their dependencies. It shows the order and sequence of tasks using nodes (activities) and arrows (dependencies).
Two types:
AOA (Activity on Arrow) – Arrows represent activities.
AON (Activity on Node) – Nodes represent activities (most common).
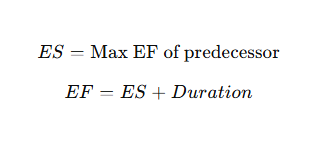
Step-3:Forward Pass:
Calculates the earliest start (ES) and earliest finish (EF) times for each activity, beginning at the project start.
Formula:
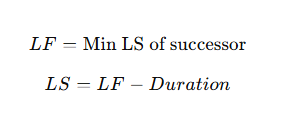
Step-4:Backward Pass:
Determines the latest start (LS) and latest finish (LF) times by moving backward from the project’s end.
Formula:
Differences Between Activity Diagrams, Network Diagrams, and Gantt Charts
Aspect
Activity Diagram
Network Diagram
Gantt Chart
Purpose
Models workflows/processes
Maps activity dependencies
Tracks task schedules over time
Visualization
Flowchart of activities
Nodes (tasks) and arrows (dependencies)
Bars showing task duration and overlap
Time Representation
No time element
Shows project timeline and dependencies
Directly shows duration, progress, and deadlines
Focus
Workflow, software modeling
Critical path and task dependencies
Schedule tracking and resource allocation
Use Case
Software and system modeling
Project planning and scheduling
Project management and tracking progress
Step-5:Calculating the Critical Path
Critical Path:
The longest path through the network diagram. It shows the sequence of tasks that determine the shortest project duration. Any delay in the critical path delays the project.
Steps to Calculate Critical Path:
List all project activities and durations.
Identify dependencies (predecessors).
Draw the network diagram.
Perform forward and backward passes.
Calculate slack for each activity.
The path with zero slack is the critical path.
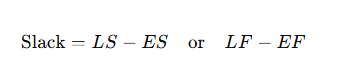
Step-6:Calculating Slack (Float)
Slack:
The amount of time an activity can be delayed without delaying the project.
Formula:
Zero Slack indicates the activity is on the critical path.