AI data centers are pivotal for modern computational tasks but demand significant resources due to their operational and structural needs.
AI data centers require significantly more resources than traditional data centers due to the unique demands of AI workloads, particularly those involving machine learning (ML) and large-scale model training and inference.
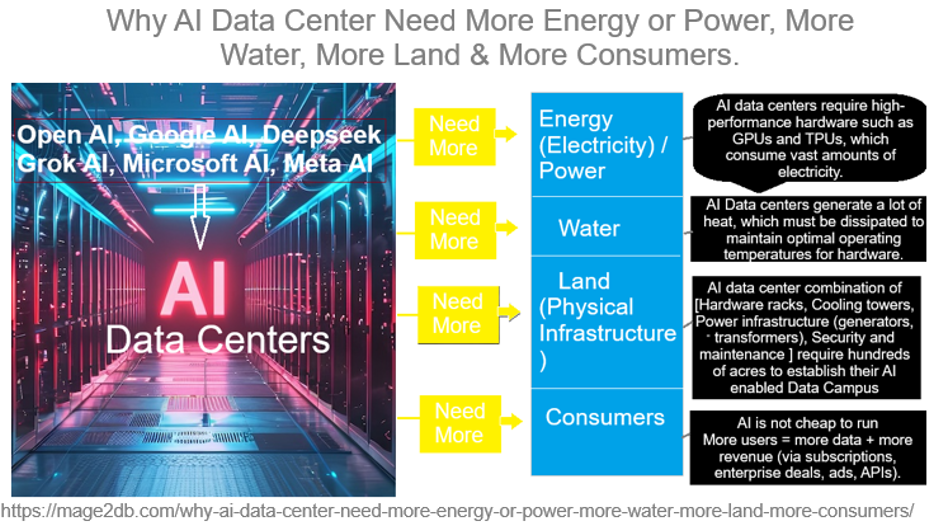
The following below steps define why AI Data Center need more Energy or Power, more Water, more Land, more consumers
Step [1] – Why Need More Energy(Electricity) / Power:
AI Algorithms workloads, especially training large models like those used for generative AI, Agentic AI, deep learning , neural networks, LLM are computationally intensive. These tasks require high-performance hardware such as GPUs and TPUs, which consume vast amounts of electricity.
AI models grow in complexity and scale, so does their energy demand.
High-Performance Computing (HPC) AI models (ChatGPT, Gemini, Grok, etc.): require massive GPUs/TPUs that consume substantial electricity clusters (e.g., NVIDIA H100s) to process and serve queries.
Training large models: consumes millions of GPU hours and vast power.
24/7 Operations: also needs constant power to keep hardware running 24/7.
Scalability: As models grow (e.g., trillion-parameter networks), energy needs rise exponentially, outpacing efficiency gains
Step [2] – Why Need More Water:
Cooling is critical for AI data centers, as the servers generate immense heat, especially in water-cooled data centers.
AI Data centers generate a lot of heat, which must be dissipated to maintain optimal operating temperatures for hardware.
Direct Cooling: Evaporative cooling towers and chilled water systems use millions of gallons annually. For example, a 15 MW data center can use up to 360,000 gallons daily.
Location Challenges: Data centers in arid regions (e.g., Arizona) strain local water resources, prompting regulatory scrutiny.
Indirect Usage: Energy production (e.g., thermoelectric power plants) often relies on water, linking energy demand to water scarcity.
For Example:: A single data center can use millions of gallons of water annually—Google’s data centers, for instance, used 5.2 billion gallons in 2023, a number likely higher now with AI expansion.
Step [3] –Why Need More Land(Physical Infrastructure ):
The scale of AI data centers is massive. The house thousands of servers, cooling systems, and backup power systems, requiring large physical spaces.
AI data center combination of [Hardware racks, Cooling towers, Power infrastructure (generators, transformers), Security and maintenance ] require hundreds of acres to establish their AI enabled Data Campus
For example: Microsoft AI, Open AI Google Gemini AI, Grok AI, Meta, Amazon AI are building AI Campus on hundreds of acres of AI-focused data campuses hundreds of thousands of square feet. As AI demand grows, companies need more land to build new facilities or expand existing ones, often in rural areas with cheaper land and power access.
Step [4] – Why Need More Consumers:
The more consumers and businesses use AI services—whether for cloud computing, generative AI applications, or enterprise solutions—the more data centers need to scale.
Revenue Model: Subscription-based AI services ( ChatGPT Plus, Grok, DeepSeek, Meta ) rely on scaling users to offset high operational costs.
Data Feedback Loop: More users generate more data, improving models (e.g., recommendation systems), which attracts more users.
AI is not cheap to run, so companies need scale to justify infrastructure.
More users = more data + more revenue (via subscriptions, enterprise deals, ads, APIs).
Step [5] –
Step [6] –