🚀 How Jira with Tempo Financial Manager Transforms Project Budgeting

Introduction

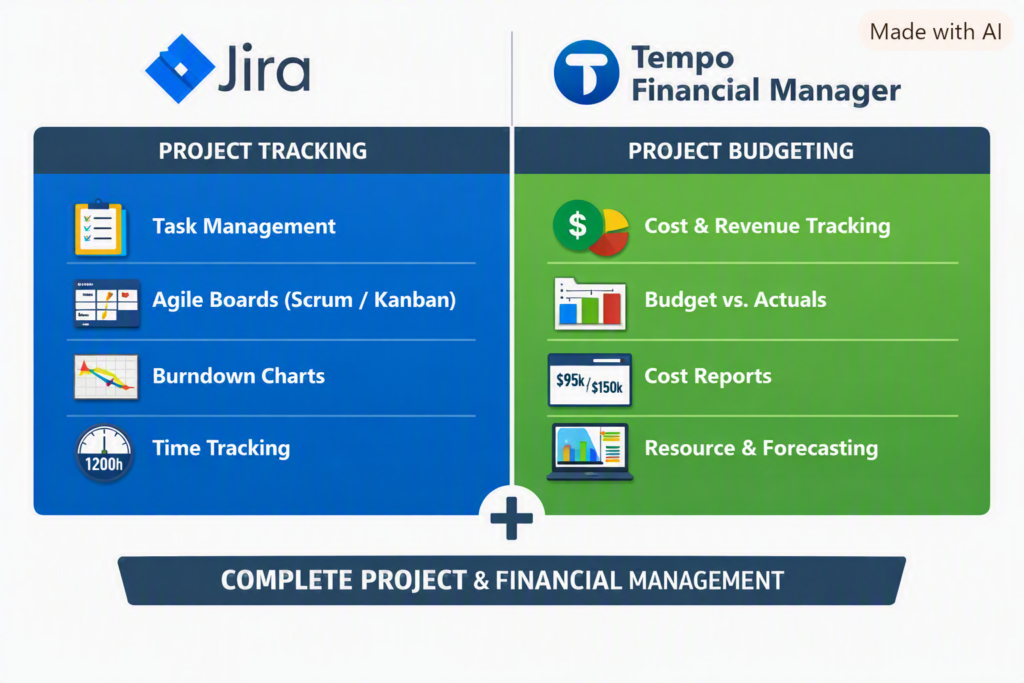
In today’s fast‑paced IT and enterprise environments, project success depends not only on timely delivery but also on financial discipline. While Jira is widely known for its powerful project tracking and Agile management capabilities, combining it with Tempo Financial Manager turns it into a complete project budgeting and financial control suite.

Jira Cloud → Handles project execution and tracking.

Tempo Financial Manager → Handles financial management and budgeting.

Together, they form a unified system — Jira with Tempo Financial Manager — that connects work effort to financial outcomes, enabling real‑time visibility for project managers and executives.

Tempo add-ons (Project budgeting and financial ) do not work with the free Jira Server . They are designed for Jira Cloud subscriptions,

💡 What Is Jira with Tempo Financial Manager?

Jira is the backbone of Agile project management — tracking tasks, sprints, and workflows. Tempo Financial Manager, an Atlassian Marketplace add‑on, extends Jira’s capabilities by adding budgeting, cost tracking, and forecasting features. Together, they provide a unified view of both project progress and financial performance.

🔧 How It Works

  1. Effort Logging: Team members log hours directly against Jira issues.
  2. Cost Conversion: Tempo applies hourly or blended rates to calculate real‑time costs.
  3. Budget Tracking: Managers define project budgets and monitor actual vs. planned spend.
  4. Forecasting: Tempo predicts future costs based on remaining work and team velocity.
  5. Reporting: Dashboards combine progress metrics with financial KPIs for executive visibility.

📊 Example Scenario
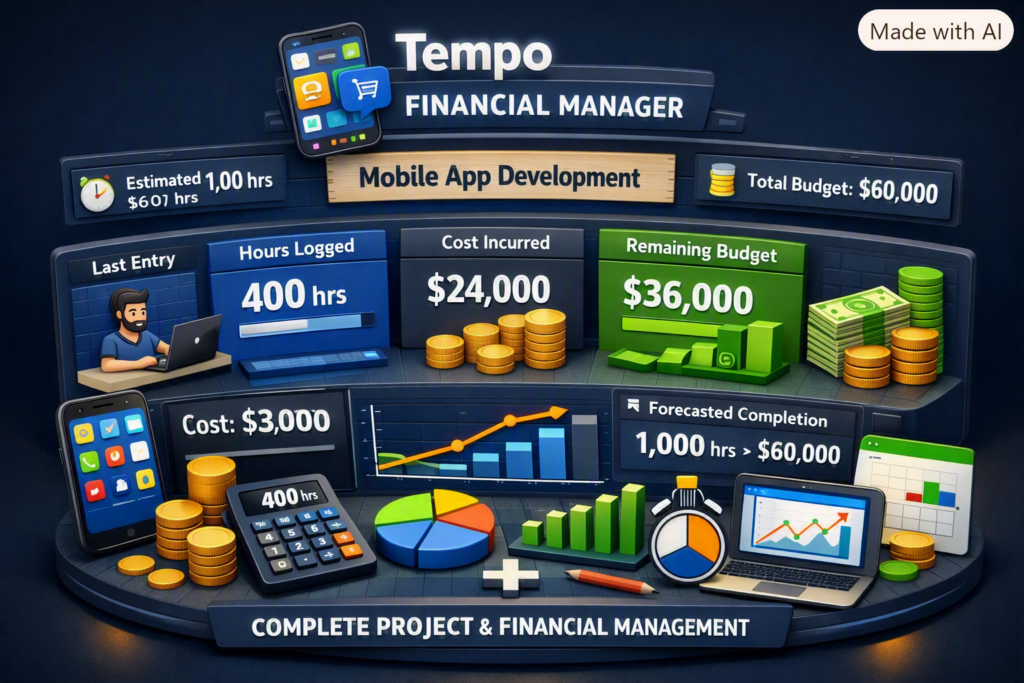
Project: Mobile App Development

  • Estimated Effort: 1,000 hours
  • Hourly Rate: $60/hr
  • Budget: $60,000

Tracking in Jira + Tempo:

  • Developer logs 50 hrs → Tempo calculates $3,000 cost.
  • Dashboard shows:
    • Hours logged: 400 hrs
    • Cost incurred: $24,000
    • Remaining budget: $36,000
    • Forecasted completion: 1,000 hrs → $60,000

This transparency helps project managers make informed decisions early, preventing overruns and optimizing resource allocation.

✅ Key Advantages

FeatureBenefit
Real‑time Cost TrackingPrevents budget surprises
Integrated DashboardsCombines progress + financials
ForecastingPredicts future spend accurately
Resource PlanningOptimizes manpower and workload
Audit‑Ready ReportsSimplifies billing and compliance

🌍 Why It’s Popular

  • Single Source of Truth: Combines project execution and financial control.
  • Agile Alignment: Perfect for sprint‑based budgeting and iterative delivery.
  • Executive Visibility: Dashboards make financials easy to understand.
  • Efficiency: Eliminates manual spreadsheets and disconnected tools.

🧠 Real‑World Impact

Organizations using Jira with Tempo report:

  • Up to 30% improvement in budget accuracy.
  • Faster decision‑making through real‑time dashboards.
  • Reduced administrative overhead by automating timesheets and cost tracking.

🔮 Imortant

Jira with Tempo Financial Manager isn’t just a tool — it’s a strategic enabler for modern project management. It empowers teams to deliver projects on time, within budget, and with full transparency. For IT leaders and project managers, this integration represents the future of data‑driven, financially intelligent project delivery.

🎯 Summary

  • Jira Cloud → Handles project execution and tracking.
  • Tempo Financial Manager → Handles financial management and budgeting. Together, they form a unified system — Jira with Tempo Financial Manager — that connects work effort to financial outcomes, enabling real‑time visibility for project managers and executives.

Project Budgeting Scenario

Example Project

Project: Healthcare Patient Portal and EHR Integration
Duration: 12 months
Approved Budget (BAC): $2 million
Delivery Model: Agile/Scrum
Team Size: 20–25 members

1. Budget Breakdown

Budget categoryPercentageAmount
Discovery and planning5%$100,000
UX and solution architecture8%$160,000
Development and integration32%$640,000
Data migration10%$200,000
QA, UAT and performance testing12%$240,000
Security and compliance6%$120,000
Cloud infrastructure and licences8%$160,000
Training and change management5%$100,000
Deployment and hypercare4%$80,000
Management contingency reserve10%$200,000
Total100%$2,000,000

2. Resource Cost Calculation

Calculate each resource’s cost using:

Resource Cost = Hourly Rate × Planned Hours

Example:

RoleNumberHours per personRateCost
Project Manager11,800$80$144,000
Solution Architect11,200$100$120,000
Developers61,600$60$576,000
QA Engineers31,400$45$189,000
DevOps Engineer11,000$70$70,000

Also include:

  • Business analysts
  • UX designers
  • Security specialists
  • Data migration engineers
  • Clinical SMEs
  • Integration consultants
  • Vendor and licence costs

3. Create the Budget Baseline

After stakeholder approval, freeze the baseline for:

  • Resource costs
  • Vendor costs
  • Cloud and infrastructure
  • Software licences
  • Travel and training
  • Testing and compliance
  • Deployment and hypercare
  • Contingency reserve

Any change affecting the approved baseline should follow formal change control.

4. Agile Budgeting

Map the budget to Jira epics or business capabilities.

EpicApproved budget
Patient registration$180,000
Appointment scheduling$220,000
EHR integration$400,000
Telehealth$250,000
Billing and insurance$300,000
Data migration$200,000
Security and compliance$120,000
Deployment and training$130,000
Contingency$200,000

Track planned and completed scope by sprint, but do not treat story points as currency. Story points measure relative complexity—not financial cost.

5. Monthly Budget Tracking

Assume that after four months:

  • Budget at Completion: $2,000,000
  • Planned Value: $800,000
  • Earned Value: $720,000
  • Actual Cost: $750,000

Cost Variance

CV = EV − AC
CV = $720,000 − $750,000
CV = −$30,000

The project is $30,000 over budget for the completed work.

Schedule Variance

SV = EV − PV
SV = $720,000 − $800,000
SV = −$80,000

The project is behind schedule.

Cost Performance Index

CPI = EV ÷ AC
CPI = 720,000 ÷ 750,000
CPI = 0.96

A CPI below 1 means cost efficiency is unfavourable.

Schedule Performance Index

SPI = EV ÷ PV
SPI = 720,000 ÷ 800,000
SPI = 0.90

The project is progressing at approximately 90% of the planned rate.

Estimate at Completion

EAC = BAC ÷ CPI
EAC = $2,000,000 ÷ 0.96
EAC = approximately $2,083,333

The project is forecast to exceed its budget by approximately $83,333 unless corrective action is taken.

6. Corrective Actions

As Project Manager, I would:

  1. Identify which workstream caused the variance.
  2. Validate vendor invoices and resource utilization.
  3. Review scope added after baseline approval.
  4. Re-estimate incomplete epics.
  5. Remove or defer low-value requirements.
  6. Resolve dependency and environment delays.
  7. Rebalance resources across workstreams.
  8. Negotiate vendor rates or deliverables.
  9. Use contingency only after governance approval.
  10. Present recovery options to the steering committee.

7. Change-Request Example

The client requests an additional telehealth capability costing $150,000 and requiring six weeks.

The change request should contain:

  • Business justification
  • Scope impact
  • Cost impact
  • Schedule impact
  • Resource requirements
  • Security and compliance impact
  • Architecture impact
  • Risks and dependencies
  • Recommended option
  • Sponsor approval

Do not silently absorb the work into the existing budget or sprint.

8. Using Jira for Budget Control

Jira is primarily used to track scope, effort and delivery—not as the organization’s financial accounting system.

In Jira, track:

  • Epic and workstream
  • Original estimate
  • Remaining estimate
  • Time spent
  • Sprint and release
  • Vendor or cost centre
  • Billable/non-billable classification
  • Budget category
  • Approved change-request reference

Use Jira dashboards to compare:

  • Planned versus completed scope
  • Estimated versus actual hours
  • Resource allocation
  • Scope added during the sprint
  • Epic progress
  • Defect and rework effort

Use MS Project, Smartsheet, ERP or finance systems for the official financial baseline and actual expenditure.

Best Interview Answer

“I begin by developing a bottom-up budget based on the WBS, resource plan, vendor estimates, infrastructure, licences, compliance, testing and deployment costs. After approval, I establish the cost baseline and track planned value, earned value and actual cost. I monitor CPI, SPI, EAC and forecast variance monthly. When a variance occurs, I identify the root cause, reforecast remaining work and present corrective options such as scope reprioritization, resource rebalancing or approved contingency usage. Any material scope change is processed through formal change control.”

Top 10 Estimation Techniques in Project Management

In project management, estimation is a critical process for predicting the time, cost, resources, and effort required to complete a project. Different estimation techniques are used depending on the project’s complexity, available data, and the stage of the project lifecycle. Below are the key estimation techniques used in project management:


1. Analogous Estimation (Top-Down Estimation)

  • Description: Uses historical data from similar past projects to estimate the current project.
  • When to Use: Early in the project when detailed information is limited.
  • Advantages:
    • Quick and easy to perform.
    • Requires minimal details.
  • Disadvantages:
    • Less accurate, as it relies on assumptions.
    • Not suitable for unique or complex projects.

2. Parametric Estimation

  • Description: Uses statistical relationships between historical data and project variables (e.g., cost per square foot, time per unit).
  • When to Use: When historical data is available and the project is well-defined.
  • Advantages:
    • More accurate than analogous estimation.
    • Scalable for large projects.
  • Disadvantages:
    • Requires reliable data and a clear understanding of variables.
    • May not account for unique project factors.

3. Bottom-Up Estimation

  • Description: Breaks the project into smaller tasks, estimates each task individually, and then aggregates the estimates.
  • When to Use: When detailed project information is available.
  • Advantages:
    • Highly accurate.
    • Provides a detailed understanding of the project.
  • Disadvantages:
    • Time-consuming.
    • Requires significant effort and expertise.

4. Three-Point Estimation

  • Description: Uses three estimates for each task:
    • Optimistic (O): Best-case scenario.
    • Pessimistic (P): Worst-case scenario.
    • Most Likely (M): Realistic scenario.
  • Formulas:
    • Triangular Distribution: Estimate=O+M+P3Estimate=3O+M+P
    • Beta Distribution (PERT): Estimate=O+4M+P6Estimate=6O+4M+P
  • When to Use: When there is uncertainty in task durations or costs.
  • Advantages:
    • Accounts for risks and uncertainties.
    • Provides a range of possible outcomes.
  • Disadvantages:
    • Requires more effort to calculate.
    • Relies on subjective judgment.

5. Expert Judgment

  • Description: Relies on the experience and intuition of experts to estimate project parameters.
  • When to Use: When historical data is unavailable or the project is unique.
  • Advantages:
    • Quick and flexible.
    • Useful for complex or innovative projects.
  • Disadvantages:
    • Subjective and prone to bias.
    • Accuracy depends on the expert’s experience.

6. Delphi Technique

  • Description: A structured method where experts provide estimates anonymously, and the results are aggregated and refined through multiple rounds of feedback.
  • When to Use: When consensus is needed among experts.
  • Advantages:
    • Reduces bias and groupthink.
    • Provides reliable estimates.
  • Disadvantages:
    • Time-consuming.
    • Requires coordination and facilitation.

7. Reserve Analysis

  • Description: Adds contingency reserves (time or cost) to the project estimate to account for uncertainties and risks.
  • When to Use: When the project has high uncertainty or risk.
  • Advantages:
    • Improves project resilience.
    • Accounts for unforeseen events.
  • Disadvantages:
    • Can lead to overestimation if not managed properly.

8. Comparative Estimation

  • Description: Compares the current project with similar past projects to estimate effort, cost, or duration.
  • When to Use: When historical data from comparable projects is available.
  • Advantages:
    • Simple and quick.
    • Useful for repetitive projects.
  • Disadvantages:
    • Less accurate for unique projects.
    • Relies on the availability of comparable data.

9. Function Point Analysis (FPA)

  • Description: Estimates the size and complexity of software projects based on the number of functions or features.
  • When to Use: For software development projects.
  • Advantages:
    • Standardized and objective.
    • Useful for measuring productivity.
  • Disadvantages:
    • Requires expertise in FPA.
    • Not suitable for non-software projects.

10. Monte Carlo Simulation

  • Description: Uses probability distributions and random sampling to simulate thousands of possible project outcomes.
  • When to Use: For complex projects with high uncertainty.
  • Advantages:
    • Provides a range of possible outcomes and probabilities.
    • Accounts for risks and uncertainties.
  • Disadvantages:
    • Requires specialized software and expertise.
    • Time-consuming to set up and run.

Choosing the Right Estimation Technique

  • Early Project Stages: Use analogous estimation or expert judgment when details are limited.
  • Detailed Planning: Use bottom-up estimation or parametric estimation when more information is available.
  • High Uncertainty: Use three-point estimationMonte Carlo simulation, or reserve analysis.
  • Software Projects: Use function point analysis or story points (in Agile).

By selecting the appropriate estimation technique(s), project managers can improve the accuracy of their estimates and set realistic expectations for stakeholders.

What is Project Scheduling & Explain Briefly

Project scheduling is a critical aspect of project management that involves planning, organizing, and managing tasks and resources to ensure the project is completed on time. Below is a step-by-step explanation of how to create and manage a project schedule:


Step 1: Define Project Scope and Objectives

  • Understand the project goals: Clearly define what the project aims to achieve.
  • Identify deliverables: List all the outputs or outcomes the project will produce.
  • Set boundaries: Determine what is included and excluded from the project scope.

Step 2: Break Down the Work (Work Breakdown Structure – WBS)

  • Decompose the project: Divide the project into smaller, manageable tasks or work packages.
  • Hierarchical structure: Organize tasks into levels (e.g., phases, deliverables, sub-tasks).
  • Ensure completeness: Make sure all tasks are accounted for to avoid missing critical work.

Step 3: Define Task Dependencies

  • Identify relationships: Determine the order in which tasks must be completed.
  • Types of dependencies:
    • Finish-to-Start (FS): Task B cannot start until Task A is finished.
    • Start-to-Start (SS): Task B cannot start until Task A starts.
    • Finish-to-Finish (FF): Task B cannot finish until Task A finishes.
    • Start-to-Finish (SF): Task B cannot finish until Task A starts (rare).
  • Use a network diagram: Visualize task dependencies to understand the flow of work.

Step 4: Estimate Task Durations

  • Gather input: Consult team members or experts to estimate how long each task will take.
  • Consider resources: Account for the availability of resources (e.g., people, equipment).
  • Use estimation techniques:
    • Expert judgment: Rely on experienced team members.
    • Analogous estimating: Use data from similar past projects.
    • Parametric estimating: Use statistical relationships (e.g., cost per unit).
    • Three-point estimating: Calculate optimistic, pessimistic, and most likely durations.

Step 5: Assign Resources

  • Identify resources: Determine the people, equipment, and materials needed for each task.
  • Allocate resources: Assign resources to tasks based on availability and skills.
  • Avoid over-allocation: Ensure resources are not overburdened by too many tasks.

Step 6: Develop the Schedule

  • Choose a scheduling tool: Use tools like Gantt charts, Microsoft Project, or software like Asana, Trello, or Jira.
  • Input tasks, durations, and dependencies: Populate the tool with the information gathered.
  • Set milestones: Identify key points in the project timeline (e.g., project phases, deliverables).
  • Calculate critical path: Identify the longest sequence of dependent tasks that determine the project duration.

Step 7: Review and Optimize the Schedule

  • Check for feasibility: Ensure the schedule is realistic and achievable.
  • Identify bottlenecks: Look for tasks that could delay the project.
  • Optimize resource allocation: Adjust resources to balance workloads.
  • Consider buffers: Add contingency time for high-risk tasks.

Step 8: Baseline the Schedule

  • Finalize the schedule: Once approved, set the schedule as the baseline.
  • Document assumptions: Record any assumptions made during scheduling.
  • Communicate the schedule: Share the baseline schedule with stakeholders and team members.

Step 9: Monitor and Control the Schedule

  • Track progress: Regularly compare actual progress to the baseline schedule.
  • Update the schedule: Adjust the schedule as needed to reflect changes or delays.
  • Manage changes: Use a change control process to handle scope or schedule changes.
  • Communicate updates: Keep stakeholders informed of any changes to the schedule.

Step 10: Close the Project

  • Review the schedule: Analyze how well the schedule was followed and identify lessons learned.
  • Document variances: Record any deviations from the baseline schedule.
  • Archive the schedule: Store the final schedule for future reference.

Key Tools and Techniques for Project Scheduling

  • Gantt Charts: Visual representation of tasks and timelines.
  • Critical Path Method (CPM): Identifies the longest path of dependent tasks.
  • Program Evaluation and Review Technique (PERT): Uses probabilistic time estimates.
  • Kanban Boards: Visual workflow management tool.
  • Resource Leveling: Balances resource allocation to avoid overloading.

Explain Activity Diagram, Network Diagram, Forward Pass, and Backward Pass

Step-1: Activity Diagram:

  • A flowchart that visually represents the sequence of activities and decisions in a process or project. It shows the flow from one activity to another but lacks time or resource detail.
  • Used primarily in UML (Unified Modeling Language) for software modeling.

Step-2: Network Diagram:

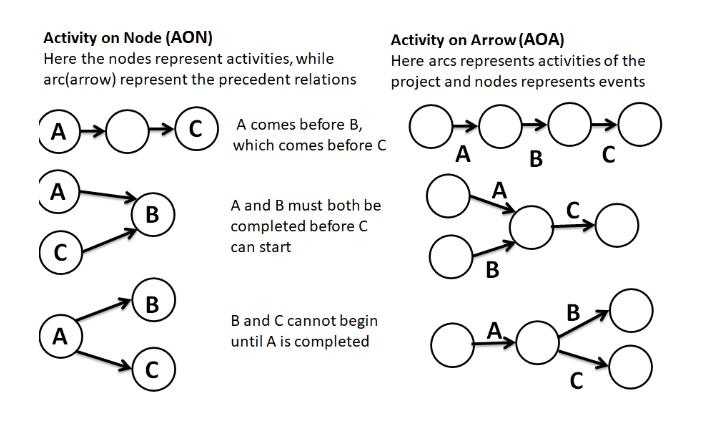
  • A graphical representation of a project’s activities and their dependencies. It shows the order and sequence of tasks using nodes (activities) and arrows (dependencies).
  • Two types:
    • AOA (Activity on Arrow) – Arrows represent activities.
    • AON (Activity on Node) – Nodes represent activities (most common).

Step-3: Forward Pass:

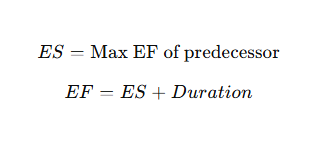
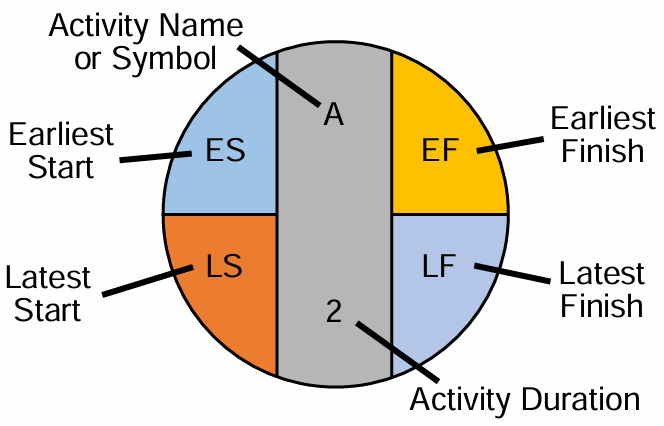
  • Calculates the earliest start (ES) and earliest finish (EF) times for each activity, beginning at the project start.
  • Formula:

Step-4: Backward Pass:

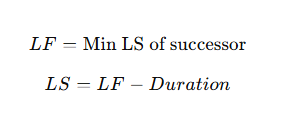
  • Determines the latest start (LS) and latest finish (LF) times by moving backward from the project’s end.
  • Formula:

Differences Between Activity Diagrams, Network Diagrams, and Gantt Charts

AspectActivity DiagramNetwork DiagramGantt Chart
PurposeModels workflows/processesMaps activity dependenciesTracks task schedules over time
VisualizationFlowchart of activitiesNodes (tasks) and arrows (dependencies)Bars showing task duration and overlap
Time RepresentationNo time elementShows project timeline and dependenciesDirectly shows duration, progress, and deadlines
FocusWorkflow, software modelingCritical path and task dependenciesSchedule tracking and resource allocation
Use CaseSoftware and system modelingProject planning and schedulingProject management and tracking progress

Step-5: Calculating the Critical Path

  • Critical Path:
    • The longest path through the network diagram. It shows the sequence of tasks that determine the shortest project duration. Any delay in the critical path delays the project.

Steps to Calculate Critical Path:

  1. List all project activities and durations.
  2. Identify dependencies (predecessors).
  3. Draw the network diagram.
  4. Perform forward and backward passes.
  5. Calculate slack for each activity.
  6. The path with zero slack is the critical path.

Step-6: Calculating Slack (Float)

  • Slack:
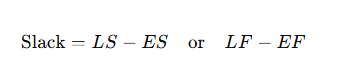
    • The amount of time an activity can be delayed without delaying the project.
    • Formula:
    • Zero Slack indicates the activity is on the critical path.