🚀 How Jira with Tempo Financial Manager Transforms Project Budgeting

Introduction

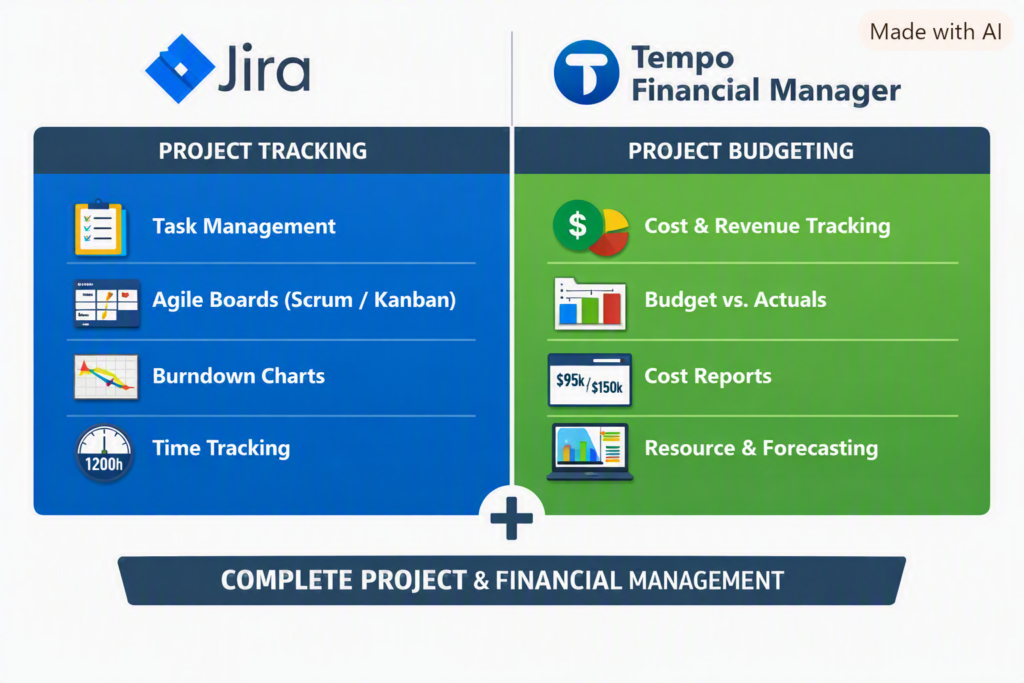
In today’s fast‑paced IT and enterprise environments, project success depends not only on timely delivery but also on financial discipline. While Jira is widely known for its powerful project tracking and Agile management capabilities, combining it with Tempo Financial Manager turns it into a complete project budgeting and financial control suite.

Jira Cloud → Handles project execution and tracking.

Tempo Financial Manager → Handles financial management and budgeting.

Together, they form a unified system — Jira with Tempo Financial Manager — that connects work effort to financial outcomes, enabling real‑time visibility for project managers and executives.

Tempo add-ons (Project budgeting and financial ) do not work with the free Jira Server . They are designed for Jira Cloud subscriptions,

💡 What Is Jira with Tempo Financial Manager?

Jira is the backbone of Agile project management — tracking tasks, sprints, and workflows. Tempo Financial Manager, an Atlassian Marketplace add‑on, extends Jira’s capabilities by adding budgeting, cost tracking, and forecasting features. Together, they provide a unified view of both project progress and financial performance.

🔧 How It Works

  1. Effort Logging: Team members log hours directly against Jira issues.
  2. Cost Conversion: Tempo applies hourly or blended rates to calculate real‑time costs.
  3. Budget Tracking: Managers define project budgets and monitor actual vs. planned spend.
  4. Forecasting: Tempo predicts future costs based on remaining work and team velocity.
  5. Reporting: Dashboards combine progress metrics with financial KPIs for executive visibility.

📊 Example Scenario
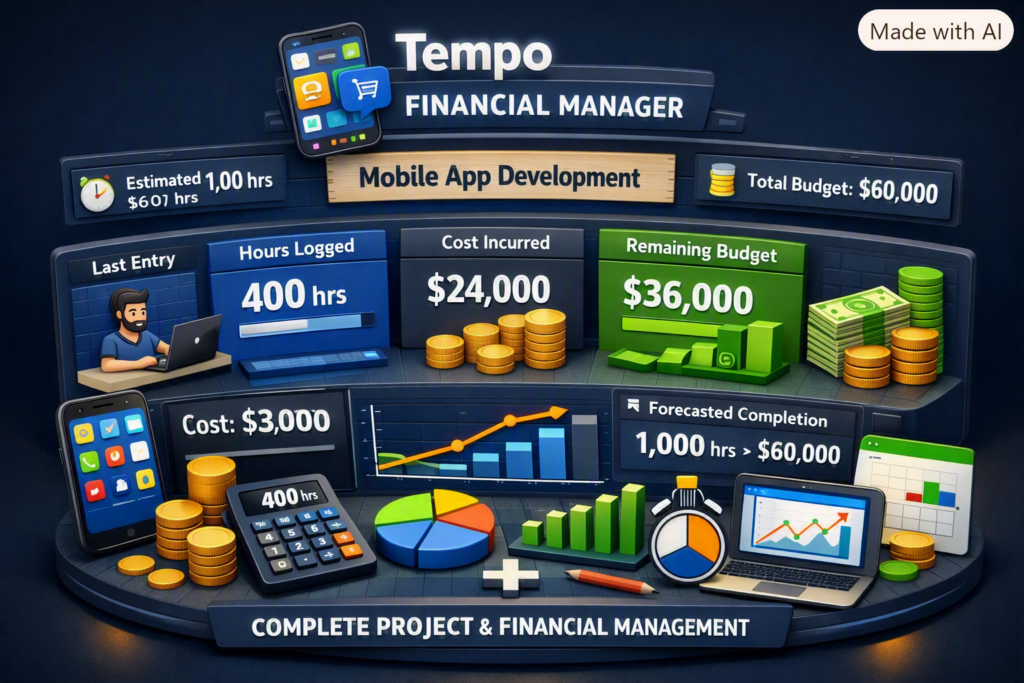
Project: Mobile App Development

  • Estimated Effort: 1,000 hours
  • Hourly Rate: $60/hr
  • Budget: $60,000

Tracking in Jira + Tempo:

  • Developer logs 50 hrs → Tempo calculates $3,000 cost.
  • Dashboard shows:
    • Hours logged: 400 hrs
    • Cost incurred: $24,000
    • Remaining budget: $36,000
    • Forecasted completion: 1,000 hrs → $60,000

This transparency helps project managers make informed decisions early, preventing overruns and optimizing resource allocation.

✅ Key Advantages

FeatureBenefit
Real‑time Cost TrackingPrevents budget surprises
Integrated DashboardsCombines progress + financials
ForecastingPredicts future spend accurately
Resource PlanningOptimizes manpower and workload
Audit‑Ready ReportsSimplifies billing and compliance

🌍 Why It’s Popular

  • Single Source of Truth: Combines project execution and financial control.
  • Agile Alignment: Perfect for sprint‑based budgeting and iterative delivery.
  • Executive Visibility: Dashboards make financials easy to understand.
  • Efficiency: Eliminates manual spreadsheets and disconnected tools.

🧠 Real‑World Impact

Organizations using Jira with Tempo report:

  • Up to 30% improvement in budget accuracy.
  • Faster decision‑making through real‑time dashboards.
  • Reduced administrative overhead by automating timesheets and cost tracking.

🔮 Imortant

Jira with Tempo Financial Manager isn’t just a tool — it’s a strategic enabler for modern project management. It empowers teams to deliver projects on time, within budget, and with full transparency. For IT leaders and project managers, this integration represents the future of data‑driven, financially intelligent project delivery.

🎯 Summary

  • Jira Cloud → Handles project execution and tracking.
  • Tempo Financial Manager → Handles financial management and budgeting. Together, they form a unified system — Jira with Tempo Financial Manager — that connects work effort to financial outcomes, enabling real‑time visibility for project managers and executives.

Project Budgeting Scenario

Example Project

Project: Healthcare Patient Portal and EHR Integration
Duration: 12 months
Approved Budget (BAC): $2 million
Delivery Model: Agile/Scrum
Team Size: 20–25 members

1. Budget Breakdown

Budget categoryPercentageAmount
Discovery and planning5%$100,000
UX and solution architecture8%$160,000
Development and integration32%$640,000
Data migration10%$200,000
QA, UAT and performance testing12%$240,000
Security and compliance6%$120,000
Cloud infrastructure and licences8%$160,000
Training and change management5%$100,000
Deployment and hypercare4%$80,000
Management contingency reserve10%$200,000
Total100%$2,000,000

2. Resource Cost Calculation

Calculate each resource’s cost using:

Resource Cost = Hourly Rate × Planned Hours

Example:

RoleNumberHours per personRateCost
Project Manager11,800$80$144,000
Solution Architect11,200$100$120,000
Developers61,600$60$576,000
QA Engineers31,400$45$189,000
DevOps Engineer11,000$70$70,000

Also include:

  • Business analysts
  • UX designers
  • Security specialists
  • Data migration engineers
  • Clinical SMEs
  • Integration consultants
  • Vendor and licence costs

3. Create the Budget Baseline

After stakeholder approval, freeze the baseline for:

  • Resource costs
  • Vendor costs
  • Cloud and infrastructure
  • Software licences
  • Travel and training
  • Testing and compliance
  • Deployment and hypercare
  • Contingency reserve

Any change affecting the approved baseline should follow formal change control.

4. Agile Budgeting

Map the budget to Jira epics or business capabilities.

EpicApproved budget
Patient registration$180,000
Appointment scheduling$220,000
EHR integration$400,000
Telehealth$250,000
Billing and insurance$300,000
Data migration$200,000
Security and compliance$120,000
Deployment and training$130,000
Contingency$200,000

Track planned and completed scope by sprint, but do not treat story points as currency. Story points measure relative complexity—not financial cost.

5. Monthly Budget Tracking

Assume that after four months:

  • Budget at Completion: $2,000,000
  • Planned Value: $800,000
  • Earned Value: $720,000
  • Actual Cost: $750,000

Cost Variance

CV = EV − AC
CV = $720,000 − $750,000
CV = −$30,000

The project is $30,000 over budget for the completed work.

Schedule Variance

SV = EV − PV
SV = $720,000 − $800,000
SV = −$80,000

The project is behind schedule.

Cost Performance Index

CPI = EV ÷ AC
CPI = 720,000 ÷ 750,000
CPI = 0.96

A CPI below 1 means cost efficiency is unfavourable.

Schedule Performance Index

SPI = EV ÷ PV
SPI = 720,000 ÷ 800,000
SPI = 0.90

The project is progressing at approximately 90% of the planned rate.

Estimate at Completion

EAC = BAC ÷ CPI
EAC = $2,000,000 ÷ 0.96
EAC = approximately $2,083,333

The project is forecast to exceed its budget by approximately $83,333 unless corrective action is taken.

6. Corrective Actions

As Project Manager, I would:

  1. Identify which workstream caused the variance.
  2. Validate vendor invoices and resource utilization.
  3. Review scope added after baseline approval.
  4. Re-estimate incomplete epics.
  5. Remove or defer low-value requirements.
  6. Resolve dependency and environment delays.
  7. Rebalance resources across workstreams.
  8. Negotiate vendor rates or deliverables.
  9. Use contingency only after governance approval.
  10. Present recovery options to the steering committee.

7. Change-Request Example

The client requests an additional telehealth capability costing $150,000 and requiring six weeks.

The change request should contain:

  • Business justification
  • Scope impact
  • Cost impact
  • Schedule impact
  • Resource requirements
  • Security and compliance impact
  • Architecture impact
  • Risks and dependencies
  • Recommended option
  • Sponsor approval

Do not silently absorb the work into the existing budget or sprint.

8. Using Jira for Budget Control

Jira is primarily used to track scope, effort and delivery—not as the organization’s financial accounting system.

In Jira, track:

  • Epic and workstream
  • Original estimate
  • Remaining estimate
  • Time spent
  • Sprint and release
  • Vendor or cost centre
  • Billable/non-billable classification
  • Budget category
  • Approved change-request reference

Use Jira dashboards to compare:

  • Planned versus completed scope
  • Estimated versus actual hours
  • Resource allocation
  • Scope added during the sprint
  • Epic progress
  • Defect and rework effort

Use MS Project, Smartsheet, ERP or finance systems for the official financial baseline and actual expenditure.

Best Interview Answer

“I begin by developing a bottom-up budget based on the WBS, resource plan, vendor estimates, infrastructure, licences, compliance, testing and deployment costs. After approval, I establish the cost baseline and track planned value, earned value and actual cost. I monitor CPI, SPI, EAC and forecast variance monthly. When a variance occurs, I identify the root cause, reforecast remaining work and present corrective options such as scope reprioritization, resource rebalancing or approved contingency usage. Any material scope change is processed through formal change control.”
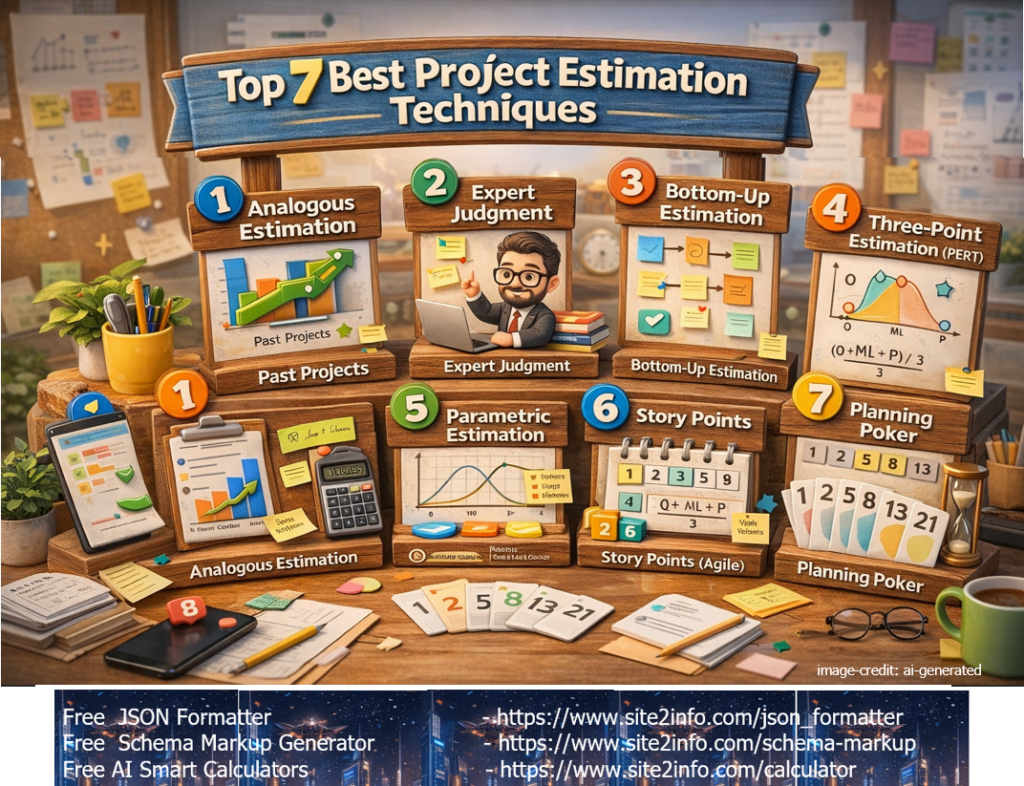
⭐ Top 7 Best Project Estimation Techniques

Detailed list of 7 Best Project Estimation Techniques


1️⃣ Expert Judgment

What it is:
Estimation based on the experience of senior team members or subject-matter experts.

Best for:

  • New or complex projects
  • Early-stage estimation

Pros: Fast, experience-driven
Cons: Can be biased


2️⃣ Analogous Estimation

What it is:
Estimating based on similar past projects.

Best for:

  • Early planning
  • High-level budgeting

Pros: Quick and simple
Cons: Less accurate if projects differ


3️⃣ Parametric Estimation

What it is:
Uses statistical formulas (e.g., cost per feature, hours per module).

Example:
10 pages × 8 hours/page = 80 hours

Best for:

  • Repetitive or standardized work

Pros: Data-driven
Cons: Needs reliable historical data


4️⃣ Bottom-Up Estimation (Most Accurate)

What it is:
Estimate each task individually and sum them.

Best for:

  • Detailed project plans
  • Execution phase

Pros: Highly accurate
Cons: Time-consuming


5️⃣ Three-Point Estimation (PERT)

What it is:
Uses 3 values:

  • Optimistic (O)
  • Most Likely (M)
  • Pessimistic (P)

Formula:
(O + 4M + P) / 6

Best for:

  • Risk-heavy projects

Pros: Accounts for uncertainty
Cons: Slightly complex


6️⃣ Agile Estimation (Story Points / Planning Poker)

What it is:
Estimation using relative sizing instead of hours.

Best for:

  • Agile / Scrum teams

Pros: Team-based, flexible
Cons: Not ideal for fixed-scope contracts


7️⃣ Function Point / Use Case Estimation

What it is:
Estimation based on functional complexity rather than time.

Best for:

  • Large enterprise software
  • Regulated industries

Pros: Technology-independent
Cons: Requires expertise


🏆 Which Estimation Technique Is Best?

There is no single best technique.
Best practice: combine multiple methods.

⭐ Most commonly used combo:

  • Early stage: Analogous + Expert Judgment
  • Planning stage: Bottom-Up + Three-Point
  • Agile projects: Story Points + Velocity

Real-World IT Examples


🔹 1️⃣ Analogous Estimation – Website Development

Scenario:
Client asks: “How long will a 20-page corporate website take?”

Approach:
Last similar website took 6 weeks → estimate 5–7 weeks.

Why it works:

  • Early proposal stage
  • No detailed requirements yet

Used for: Pre-sales, ballpark budgeting
Not used for: Final contracts


🔹 2️⃣ Bottom-Up Estimation – E-Commerce Platform

Scenario:
Building an eCommerce site (Adobe Commerce / Shopify Plus)

Approach:
Break into tasks:

  • UI Design → 40 hrs
  • Backend APIs → 120 hrs
  • Checkout → 60 hrs
  • Payment Gateway → 30 hrs
  • QA → 50 hrs

Total = 300 hrs

Why it works:

  • Highly accurate
  • Clear task ownership

Best for: Fixed-scope projects, delivery planning
Risk: Time-consuming to prepare


🔹 3️⃣ Three-Point Estimation – Payment Gateway Integration

Scenario:
Integration with external payment provider (high uncertainty)

Estimate TypeTime
Optimistic (O)5 days
Most Likely (M)8 days
Pessimistic (P)14 days

PERT Formula:
(5 + 4×8 + 14) ÷ 6 = 8.5 days

Why it works:

  • Accounts for risk & unknowns
  • Better stakeholder confidence

Best for: Integration, migration, legacy systems


🔹 4️⃣ Agile Delivery Estimation – Mobile App Development

Scenario:
Scrum team delivering features in sprints

Approach:

  • User Story A → 5 points
  • User Story B → 8 points
  • User Story C → 3 points

Team Velocity: 20 points / sprint
→ Delivery in 1 sprint

Why it works:

  • Flexible
  • Team-driven
  • Continuous improvement

Best for: Evolving requirements, product development
Not ideal: Fixed-price contracts

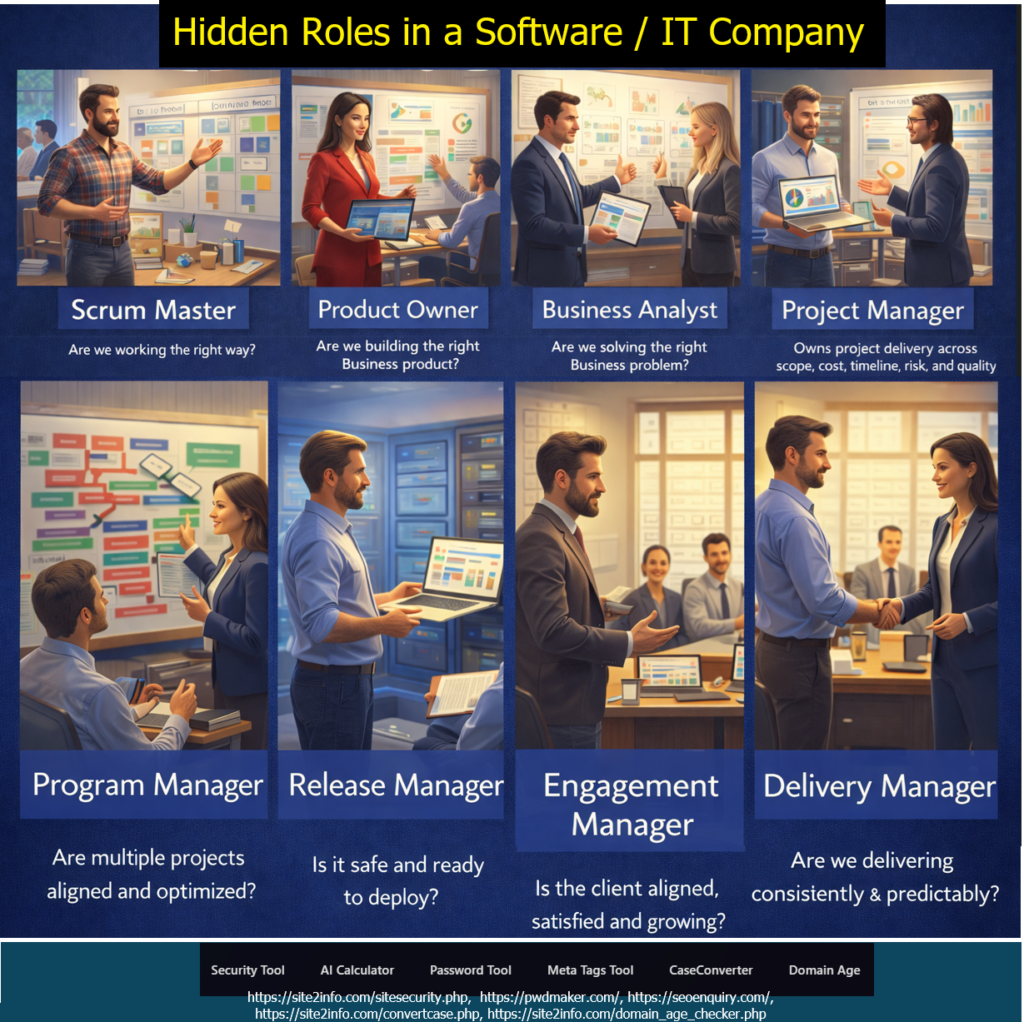
Hidden Roles in a Software / IT Company

The Silent Force Behind Successful Digital Delivery

When people think of a software company, the first roles that come to mind are usually developers, testers, and designers. While these roles are essential, they represent only the visible layer of delivery.

Behind every successful software product is a network of leadership, analysis, governance, and execution roles that ensure clarity, alignment, predictability, and business value.

These are the hidden — yet critical — roles that make modern software delivery work.


Why These Roles Matter More Than Ever

Most software failures don’t happen due to poor coding.
They happen because of:

  • Unclear requirements
  • Misaligned business goals
  • Weak stakeholder communication
  • Poor prioritization
  • Risky or rushed releases
  • Inconsistent delivery

Each of the roles below exists to prevent one or more of these failures.


1️⃣ Business Analyst (BA)

“Are we solving the right business problem?”

The Business Analyst ensures the team builds the right solution, not just a technically correct one.

Key Responsibilities:

  • Understands business goals and pain points
  • Translates business needs into clear requirements
  • Defines functional and non-functional requirements
  • Bridges business stakeholders and technical teams
  • Ensures requirements are testable and measurable

👉 Without a strong BA, teams risk building features that nobody truly needs.


2️⃣ Product Owner (PO)

“Are we building the right product?”

The Product Owner owns product value.

Key Responsibilities:

  • Defines and prioritizes the product backlog
  • Balances business value, user needs, and technical feasibility
  • Accepts or rejects completed work
  • Aligns product roadmap with business strategy
  • Maximizes ROI from the development effort

👉 The Product Owner ensures the team builds what matters most—at the right time.


3️⃣ Scrum Master

“Are we working the right way?”

The Scrum Master protects the process and team effectiveness.

Key Responsibilities:

  • Facilitates Scrum ceremonies
  • Removes impediments blocking the team
  • Coaches the team on Agile and Scrum principles
  • Promotes continuous improvement
  • Shields the team from unnecessary disruptions

👉 A great Scrum Master doesn’t manage people—they enable performance.


4️⃣ Project Manager (PM)

“Are we on track and under control?”

The Project Manager owns execution governance.

Key Responsibilities:

  • Manages scope, timeline, cost, risk, and quality
  • Tracks milestones and dependencies
  • Handles escalation and change management
  • Communicates project status to stakeholders
  • Ensures commitments are met

👉 Project Managers bring discipline, predictability, and control to delivery.


5️⃣ Engagement Manager

“Is the client aligned, satisfied, and growing?”

The Engagement Manager owns the client relationship.

Key Responsibilities:

  • Manages client expectations and trust
  • Acts as the primary escalation point
  • Aligns delivery outcomes with business goals
  • Identifies account growth opportunities
  • Ensures long-term partnership success

👉 Even a successful project can fail without strong engagement management.


6️⃣ Program Manager

“Are multiple projects aligned and optimized?”

Program Managers operate at a strategic level.

Key Responsibilities:

  • Coordinates multiple related projects
  • Manages cross-project dependencies and risks
  • Aligns initiatives with organizational strategy
  • Optimizes resources across teams
  • Provides consolidated executive reporting

👉 Program Managers ensure the big picture doesn’t break while teams focus on details.


7️⃣ Release Manager

“Is it safe and ready to deploy?”

The Release Manager ensures controlled, stable deployments.

Key Responsibilities:

  • Plans release calendars and go-live strategies
  • Coordinates across Dev, QA, Security, and Ops
  • Ensures compliance and rollback readiness
  • Manages release approvals
  • Minimizes production risk

👉 Release Managers protect business continuity and customer trust.


8️⃣ Delivery Manager

“Are we delivering consistently and predictably?”

The Delivery Manager owns delivery excellence.

Key Responsibilities:

  • Owns end-to-end delivery outcomes
  • Tracks delivery metrics and predictability
  • Manages team capacity and performance
  • Removes delivery bottlenecks
  • Ensures repeatable, scalable delivery

👉 Delivery Managers turn plans into results—again and again.


How These Roles Work Together

These roles are not redundant—they are complementary:

  • Business Analyst defines the right problem
  • Product Owner defines the right product
  • Scrum Master ensures the right way of working
  • Project Manager ensures control and predictability
  • Engagement Manager ensures client success
  • Program Manager ensures strategic alignment
  • Release Manager ensures safe deployment
  • Delivery Manager ensures consistent execution

Together, they create a high-maturity delivery organization.

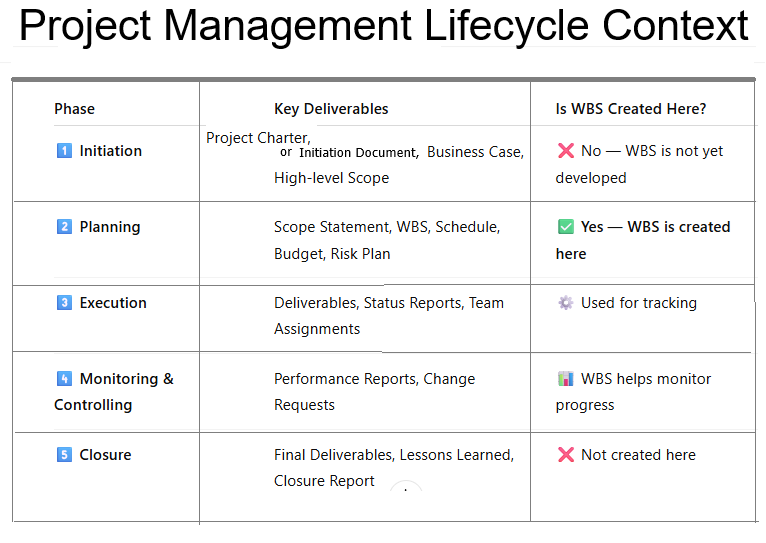
Define Project Management Life Cycle

These are the 5 Project Management Process Groups defined by PMI (Project Management Institute) in the PMBOK (Project Management Body of Knowledge).

These are NOT SDLC phases — they are Project Management Phases used in any type of project, including IT, software, construction, and business operations.


1️⃣ Initiation Phase

Purpose: Start the project formally
Activities include:

  • Define project goals
  • Create Project Charter
  • Identify stakeholders
  • High-level scope & feasibility

2️⃣ Planning Phase

Purpose: Plan how the project will be executed
Activities include:

  • Detailed project plan
  • Scope planning
  • Schedule & timeline
  • Budget planning
  • Risk management plan
  • Resource planning
  • Communication plan

3️⃣ Execution Phase

Purpose: Do the actual work
Activities include:

  • Team execution
  • Development, design, testing
  • Managing stakeholders
  • Quality management
  • Task assignments
  • Delivering project outputs

4️⃣ Monitoring & Controlling Phase

Purpose: Track progress and control deviations
Activities include:

  • Monitor KPIs
  • Control scope changes
  • Track timeline and budget
  • Ensure quality standards
  • Issue/risk management
  • Status reporting

5️⃣ Closure Phase

Purpose: Formally end the project
Activities include:

  • Final deliverables
  • Approvals and sign-off
  • Documentation
  • Lessons learned
  • Release resources
  • Project completion report

Explain all SDLC Methodologies or SDLC Models

SDLC (Software Development Life Cycle) methodologies are structured frameworks used to plan, design, build, test, and maintain software

 It breaks down the complex process into distinct phases, providing a framework that helps manage time, resources, and risks throughout the development of a software product.

Types of SDLC Methodologies or SDLC Models

1️⃣ Waterfall Model

A linear and sequential development model where each phase must be completed before moving to the next.

Key Features:

  • Requirements → Design → Development → Testing → Deployment → Maintenance
  • No going back to previous phases
  • Best for projects with clear, fixed requirements

Used In:

Government, manufacturing, construction, highly controlled environments.


2️⃣ Iterative Model

The product is built step-by-step in small cycles, with feedback after each iteration.

Key Features:

  • Build → Test → Improve → Repeat
  • Each version is better than the previous
  • Reduces risk early
  • Good when complete requirements are not known initially

Used In:

Prototyping, early-stage product development, systems requiring gradual evolution.


3️⃣ Spiral Model

A risk-driven software development model combining Waterfall + Iterative + Risk Management.

Key Features:

  • Each spiral = Planning → Risk Analysis → Engineering → Evaluation
  • Focuses on risk reduction
  • Excellent for large, complex, high-risk projects

Used In:

Defense, aerospace, expensive systems where failure is costly.


4️⃣ V-Model (Verification & Validation Model)

A “V-shaped” model where testing activities happen in parallel with development phases.

Key Features:

  • Each development phase has a corresponding testing phase
  • Very structured and strict
  • Great for systems requiring validation & compliance

Used In:

Healthcare, automotive, safety-critical software, regulated industries.


5️⃣ Big Bang Model

Little to no planning — development starts immediately and evolves as needed.

Key Features:

  • No formal process
  • Suitable only for small, experimental, or short projects
  • Very high risk and unpredictable

Used In:

POCs, experiments, small teams building quick concepts.


6️⃣ Agile Model

An adaptive, flexible, iterative model where development happens in small increments (Sprints).

Key Features:

  • Continuous improvement
  • Responding to change over following a strict plan
  • Customer involvement at every step
  • Works in Sprints (Scrum) or flows (Kanban)

Used In:

Modern software development, ecommerce, SaaS, mobile apps, startups.

📌 Are these the only SDLC models?

No — but they are the most standard and widely used models.

Other recognized SDLC approaches include:

  • Incremental Model
  • Prototype Model
  • RAD (Rapid Application Development) Model
  • DevOps Model
  • Hybrid Model (Agile + Waterfall)
  • Scrum Framework (under Agile)
  • Kanban (under Agile)

But the core SDLC models (commonly taught and used) are exactly the ones you included.

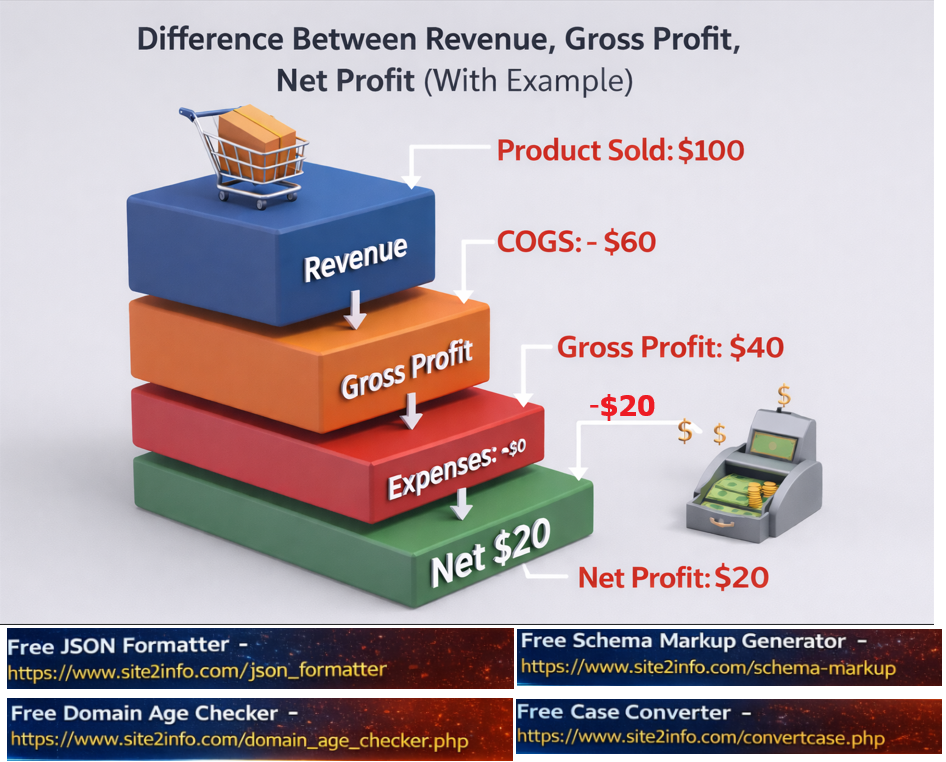
Difference Between Revenue , Gross Profit, Net Profit with Example

Step [1] – Revenue (also called Sales or Top Line):

This is the total amount of money a business earns from selling goods or services before any expenses are deducted.

Revenue – all the money that came in.”

Step [2] – Gross Profit:

This is what’s left from Revenue after subtracting the Cost of Goods Sold (COGS). COGS includes direct costs like materials and labor used to produce the product.

Gross Profit – money left after making the product, but before paying bills.”

Formula:

Gross Profit = Revenue – Cost of Goods Sold

Step [3] –Net Profit: Net Profit (also called Bottom Line or Net Income

Net Profitwhat you actually keep in the end.”)

Formula:

Net Profit = Gross Profit – Operating Expenses – Taxes – Interest

Example: Here Mage2DB Company Data

Revenue=$100000
Cost of Goods Sold=$40000
Operating Expenses (rent, salaries, marketing, etc.) =$20000
Taxes & Interest=$10000

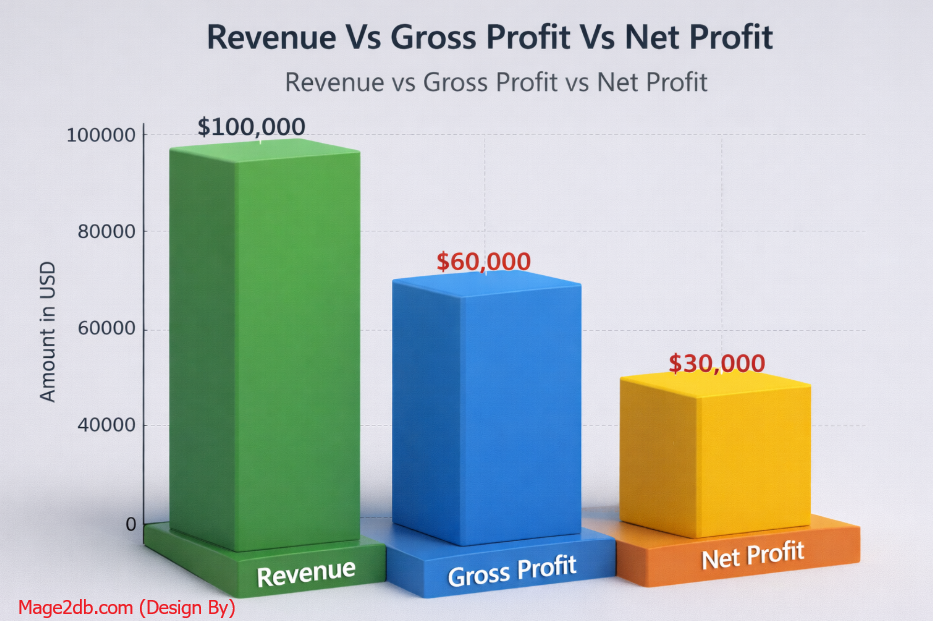
As per above company Mage2db company data

Revenue: $100,000

Gross Profit (Revenue – COGS): = $100000-$40000=$60,000

Net Profit (Gross Profit – Operating Expenses – Taxes & Interest):

$60000-$20000-$10000=$30,000

Top 10 Estimation Techniques in Project Management

In project management, estimation is a critical process for predicting the time, cost, resources, and effort required to complete a project. Different estimation techniques are used depending on the project’s complexity, available data, and the stage of the project lifecycle. Below are the key estimation techniques used in project management:


1. Analogous Estimation (Top-Down Estimation)

  • Description: Uses historical data from similar past projects to estimate the current project.
  • When to Use: Early in the project when detailed information is limited.
  • Advantages:
    • Quick and easy to perform.
    • Requires minimal details.
  • Disadvantages:
    • Less accurate, as it relies on assumptions.
    • Not suitable for unique or complex projects.

2. Parametric Estimation

  • Description: Uses statistical relationships between historical data and project variables (e.g., cost per square foot, time per unit).
  • When to Use: When historical data is available and the project is well-defined.
  • Advantages:
    • More accurate than analogous estimation.
    • Scalable for large projects.
  • Disadvantages:
    • Requires reliable data and a clear understanding of variables.
    • May not account for unique project factors.

3. Bottom-Up Estimation

  • Description: Breaks the project into smaller tasks, estimates each task individually, and then aggregates the estimates.
  • When to Use: When detailed project information is available.
  • Advantages:
    • Highly accurate.
    • Provides a detailed understanding of the project.
  • Disadvantages:
    • Time-consuming.
    • Requires significant effort and expertise.

4. Three-Point Estimation

  • Description: Uses three estimates for each task:
    • Optimistic (O): Best-case scenario.
    • Pessimistic (P): Worst-case scenario.
    • Most Likely (M): Realistic scenario.
  • Formulas:
    • Triangular Distribution: Estimate=O+M+P3Estimate=3O+M+P
    • Beta Distribution (PERT): Estimate=O+4M+P6Estimate=6O+4M+P
  • When to Use: When there is uncertainty in task durations or costs.
  • Advantages:
    • Accounts for risks and uncertainties.
    • Provides a range of possible outcomes.
  • Disadvantages:
    • Requires more effort to calculate.
    • Relies on subjective judgment.

5. Expert Judgment

  • Description: Relies on the experience and intuition of experts to estimate project parameters.
  • When to Use: When historical data is unavailable or the project is unique.
  • Advantages:
    • Quick and flexible.
    • Useful for complex or innovative projects.
  • Disadvantages:
    • Subjective and prone to bias.
    • Accuracy depends on the expert’s experience.

6. Delphi Technique

  • Description: A structured method where experts provide estimates anonymously, and the results are aggregated and refined through multiple rounds of feedback.
  • When to Use: When consensus is needed among experts.
  • Advantages:
    • Reduces bias and groupthink.
    • Provides reliable estimates.
  • Disadvantages:
    • Time-consuming.
    • Requires coordination and facilitation.

7. Reserve Analysis

  • Description: Adds contingency reserves (time or cost) to the project estimate to account for uncertainties and risks.
  • When to Use: When the project has high uncertainty or risk.
  • Advantages:
    • Improves project resilience.
    • Accounts for unforeseen events.
  • Disadvantages:
    • Can lead to overestimation if not managed properly.

8. Comparative Estimation

  • Description: Compares the current project with similar past projects to estimate effort, cost, or duration.
  • When to Use: When historical data from comparable projects is available.
  • Advantages:
    • Simple and quick.
    • Useful for repetitive projects.
  • Disadvantages:
    • Less accurate for unique projects.
    • Relies on the availability of comparable data.

9. Function Point Analysis (FPA)

  • Description: Estimates the size and complexity of software projects based on the number of functions or features.
  • When to Use: For software development projects.
  • Advantages:
    • Standardized and objective.
    • Useful for measuring productivity.
  • Disadvantages:
    • Requires expertise in FPA.
    • Not suitable for non-software projects.

10. Monte Carlo Simulation

  • Description: Uses probability distributions and random sampling to simulate thousands of possible project outcomes.
  • When to Use: For complex projects with high uncertainty.
  • Advantages:
    • Provides a range of possible outcomes and probabilities.
    • Accounts for risks and uncertainties.
  • Disadvantages:
    • Requires specialized software and expertise.
    • Time-consuming to set up and run.

Choosing the Right Estimation Technique

  • Early Project Stages: Use analogous estimation or expert judgment when details are limited.
  • Detailed Planning: Use bottom-up estimation or parametric estimation when more information is available.
  • High Uncertainty: Use three-point estimationMonte Carlo simulation, or reserve analysis.
  • Software Projects: Use function point analysis or story points (in Agile).

By selecting the appropriate estimation technique(s), project managers can improve the accuracy of their estimates and set realistic expectations for stakeholders.

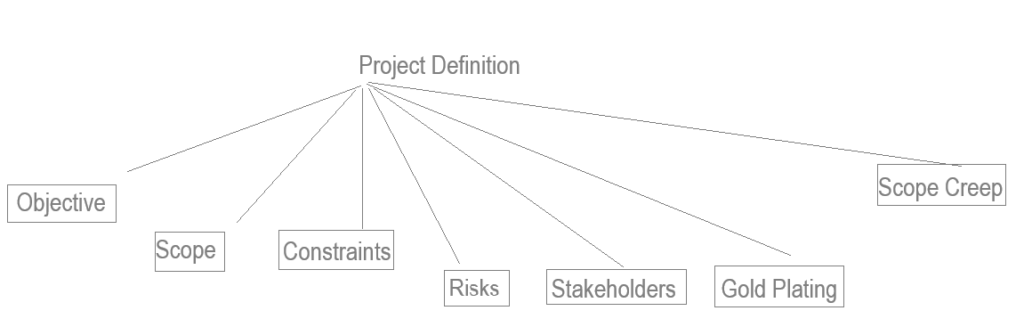
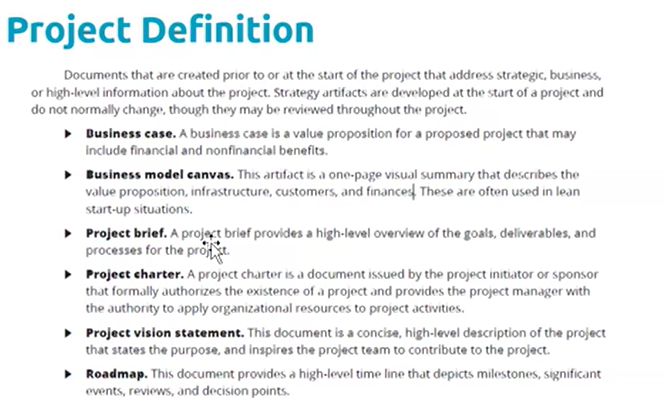
Project Definition Objective, Scope, Constraints, Risks, Stakeholders, Gold Plating, Scope Creep

Project definition refers to the process of clearly outlining the purpose, objectives, deliverables, and boundaries of a project. It serves as the foundation for planning, execution, and monitoring. A well-defined project includes the following elements:

  1. Objectives: Clear, measurable goals that the project aims to achieve.
  2. Scope: The specific tasks, activities, and deliverables that the project will include.
  3. Constraints: Limits on time, budget, and resources.
  4. Stakeholders: Identification of those impacted by or involved in the project.
  5. Risks: Potential challenges or issues that might arise.
  6. Success Criteria: Benchmarks to measure project success.
  7. Requirements: are gathered from all stakeholders ,

• Requirements gathering can take a long time
• While project is completed, only the work in PM plan should be done

Project Management Terms (Gold Plating, Scope Creep) of Project Definition

Gold Plating in Project Definition

Gold plating refers to delivering more than what is required or adding extra features or functionality that were not initially part of the project’s agreed-upon scope. It is done without formal approval and often stems from an overzealous desire to exceed expectations.

Examples of Gold Plating:

  • Adding extra software features to a product beyond what the client requested.
  • Delivering additional marketing materials that were not in the original plan.

Risks of Gold Plating:

  1. Increases project costs and time.
  2. May lead to dissatisfaction if the additional features create complications or deviate from the client’s needs.
  3. Diverts resources from critical tasks.

How to Avoid Gold Plating:

  • Stick to the defined project scope.
  • Obtain formal approval for any scope changes.
  • Regularly communicate with stakeholders about deliverables.

Scope Creep in Project Definition

Scope creep refers to uncontrolled or unauthorized changes and continuous expansion of a project’s scope without adjustments to time, cost, or resources. Unlike gold plating, scope creep often arises from external factors, such as changing client demands or poorly defined project boundaries.

Examples of Scope Creep:

  • Adding additional deliverables because the client requests them midway through the project without formally adjusting the project scope.
  • Extending deadlines to accommodate newly introduced tasks.

Risks of Scope Creep:

  1. Delays project completion.
  2. Leads to budget overruns.
  3. Causes team burnout due to unforeseen workload.
  4. Risks project failure due to loss of focus.

How to Prevent Scope Creep:

  1. Clearly Define the Scope: Develop detailed project requirements in the planning phase.
  2. Establish Change Control Processes: Require formal approvals for scope changes.
  3. Communicate Boundaries: Ensure stakeholders understand the agreed-upon scope.
  4. Regularly Monitor Progress: Use project management tools to identify deviations early.

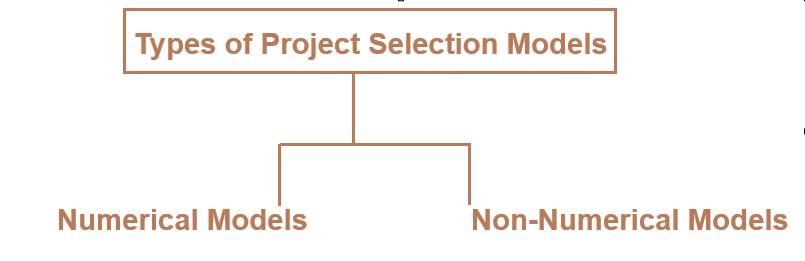
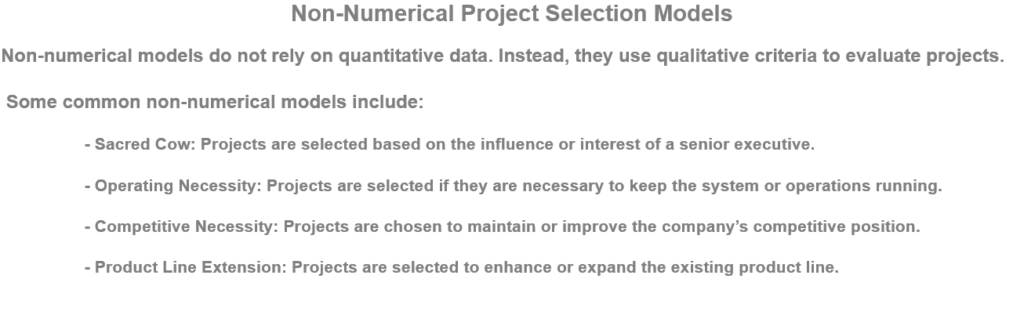
Types of Project Selection Models – Numerical Models & Non-Numerical Models

There are two basic types of project selection models, numeric and non-numeric. Both are widely used. Many organization use both at the same time or they use models that are combinations of the two

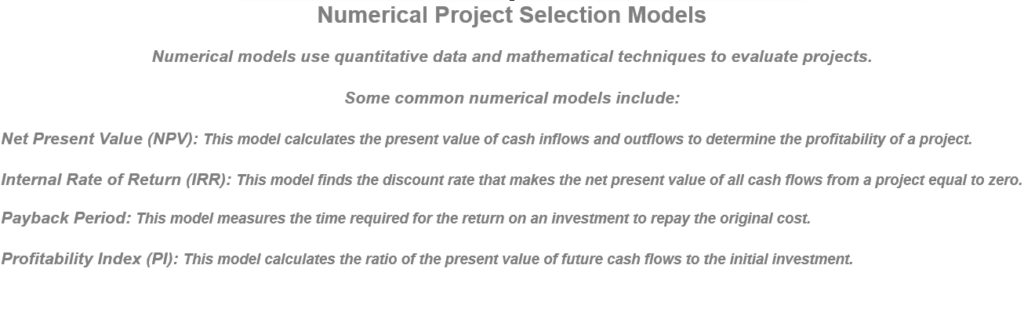
1. Numerical Models

Numerical models are quantitative methods that use numerical data and calculations to evaluate and compare projects.

Characteristics:

  • Relies on measurable data (e.g., costs, revenues, time).
  • Objective and data-driven.
  • Focuses on financial or quantifiable outcomes.

Types of Numerical Models:

  1. Profitability Models:
    • Evaluate financial viability.
    • Examples:
      • Net Present Value (NPV): Measures the present value of cash flows against investment costs.
      • Internal Rate of Return (IRR): Calculates the discount rate where NPV equals zero.
      • Payback Period: Time required to recover the project investment.
      • Benefit-Cost Ratio (BCR): Ratio of benefits to costs; a higher BCR is preferred.
  2. Scoring Models:
    • Assigns weights to criteria based on importance and scores projects accordingly.
    • Example:
      • Weighted Scoring Model: Combines scores across criteria (e.g., risk, ROI, alignment with strategy).

Advantages:

  • Provides clear, comparable metrics.
  • Helps assess financial feasibility and return on investment.

Disadvantages:

  • May overlook non-quantifiable benefits (e.g., reputation, employee satisfaction).

2. Non-Numerical Models

Non-numerical models are qualitative approaches that rely on subjective assessments and strategic considerations.

Characteristics:

  • Focuses on alignment with organizational goals and priorities.
  • Emphasizes qualitative factors like innovation, market trends, or social impact.
  • Less dependent on numerical data.

Types of Non-Numerical Models:

  1. Checklist Model:
    • Projects are evaluated using a checklist of criteria (e.g., “Does it align with organizational goals?”).
    • Simple “yes” or “no” answers determine project viability.
  2. Strategic Alignment Model:
    • Assesses how well a project aligns with the organization’s strategic objectives.
  3. Profile Model:
    • Compares projects based on risk and return profiles.
    • Helps visualize trade-offs between risk and potential benefits.
  4. Sacred Cow Model:
    • Projects are selected based on leadership preferences or strategic directives, regardless of other factors.

Advantages:

  • Captures non-financial and strategic benefits.
  • Useful for innovative or exploratory projects.

Disadvantages:

  • Subjective and prone to bias.
  • Lacks consistency across evaluations

Explain Functional, Projectized & Matrix Organization

There are following three type organization in Industry

[1] – Functional Organization It is Power of Functional Manager

Features of Functional Organization

  • Employees are grouped based on their functional areas of expertise, such as marketing, finance, IT, or human resources.
  • Each function operates independently, with a clear hierarchy and reporting structure.
  • Departments work on their specific tasks and are managed by functional managers.
  • The project manager’s role is limited or nonexistent; functional managers have full control.

Functional Organization: Suitable for organizations with routine operations and minimal project demands.

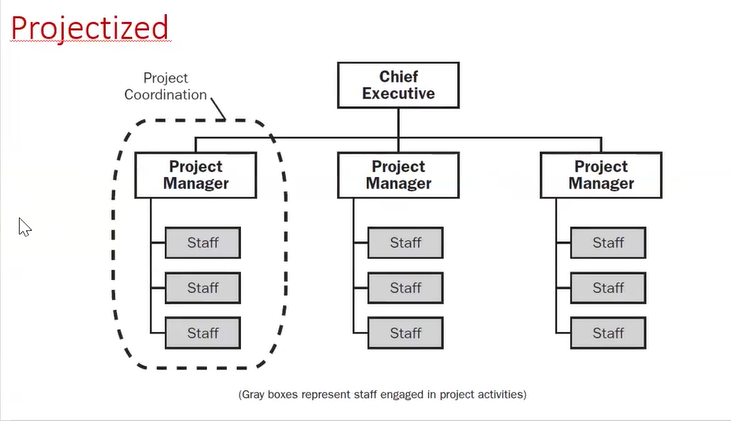
[2] – Projectized Organization:: It is Power of Project Manager

Features of Projectized Organization

  • The organization is structured around projects rather than functional departments.
  • Teams are formed specifically for projects, and team members report directly to the project manager.
  • The project manager has full authority over the team and resources.
  • Teams are disbanded after project completion & The organization focuses on delivering projects.

Projectized Organization: Ideal for project-focused industries like construction or event management.

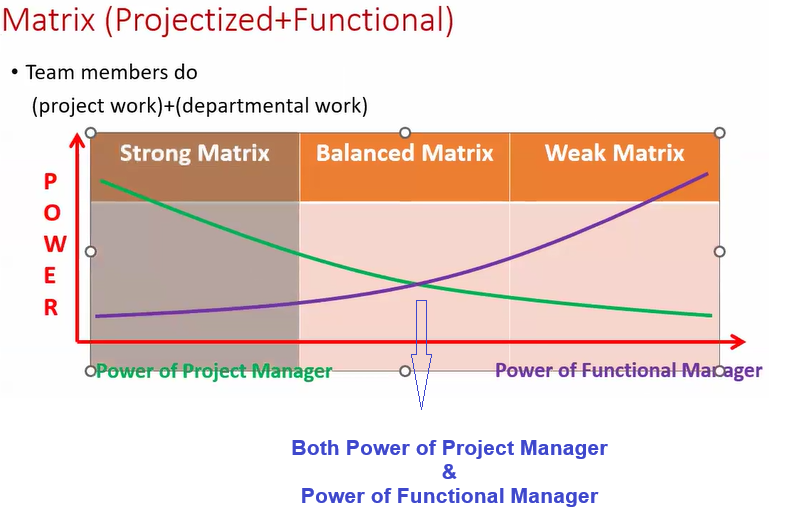
[3] – Matrix Organization:: combination of both Functional & Projectized organization

Features of Matrix Organization

  • Combines elements of both functional and projectized structures.
  • Employees report to both functional and project managers, sharing responsibilities between their department and projects.

Matrix Organization is most popular Organization.

Matrix Organization: Best for organizations balancing both ongoing operations and multiple simultaneous project

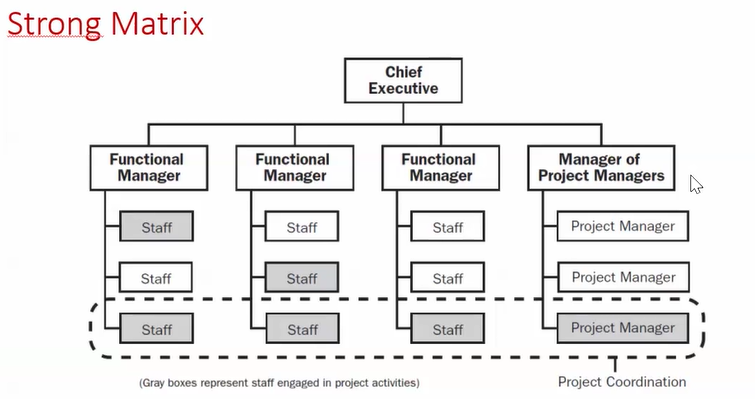
[a] – Strong Matrix

The project manager has more authority, similar to a projectized organization.

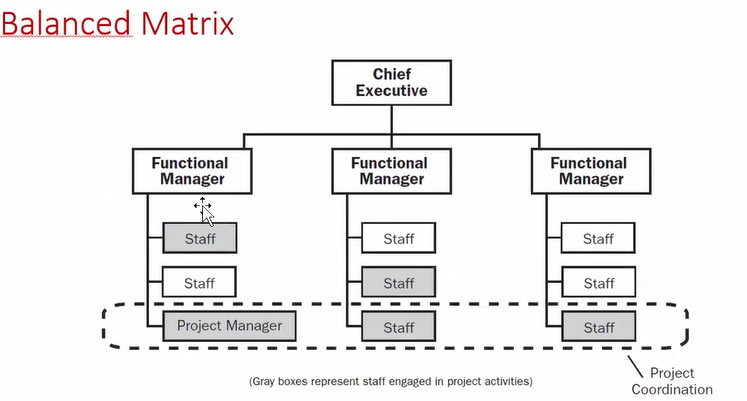
[b] – Balanced Matrix

  • Equal authority between functional and project managers.
  • Both collaborate to make decisions.

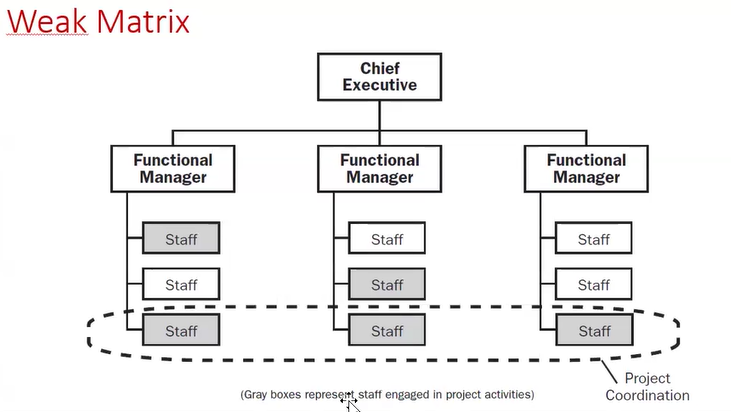
[c] – Weak Matrix

  • Functional managers retain primary control.
  • The project manager has a coordination role with limited authority.

Relationship Between Both Project Manager & Functional Manager & Matrix