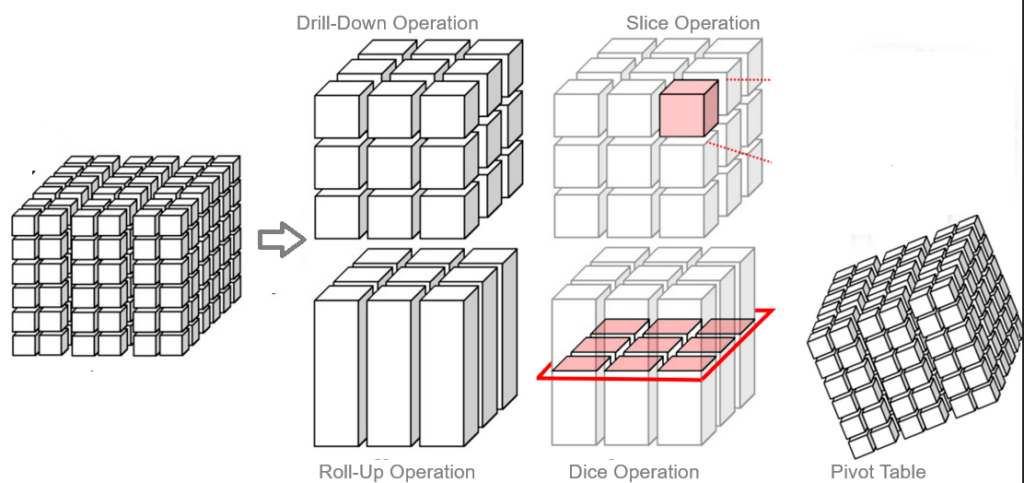
The Multidimensional data cube is a multi-dimensional array of data used for OLAP (Online Analytical Processing)
A Multidimensional data cube allows data to be viewed in multiple dimensions.
1. Roll-Up or Drill Up Operation
Roll-up is an aggregation operation that summarizes data by climbing up a concept hierarchy or by dimension reduction. It’s like zooming out to see a broader view.
Example: Sales data cube with dimensions: Location (City), Time (Month), and Product.
A roll-up operation might aggregate sales data from the city level to the country level.
Below Data Before Roll-Up:
- City: Sales in New York, Los Angeles, Chicago
- Month: January, February, March
- Product: Laptops, Tablets, Phones
Below Data After Roll-Up:
- Country: Sales in USA
- Quarter: Q1
- Product: Laptops, Tablets, Phones
2. Drill-Down Operation
Drill-down is the reverse of roll-up. It provides more detailed data by descending a concept hierarchy or adding dimensions. It’s like zooming in to see finer details.
Example: Using the same sales data cube, a drill-down operation might break down sales data from the country level to the city level.
Below Data Before Drill-Down:
- Country: Sales in USA
- Quarter: Q1
- Product: Laptops, Tablets, Phones
Below Data After Drill-Down:
- City: Sales in New York, Los Angeles, Chicago
- Month: January, February, March
- Product: Laptops, Tablets, Phones
3. Slice Operation
Slice selects a single dimension from the data cube, creating a sub-cube by fixing a value for one dimension.
Selection on one dimension of the given cube, resulting in a sub cube.
Example: If we want to analyze sales data for January only, we perform a slice operation on the Time dimension.
Below Data Before Slice:
- City: Sales in New York, Los Angeles, Chicago
- Month: January, February, March
- Product: Laptops, Tablets, Phones
Below Data After Slice:
- City: Sales in New York, Los Angeles, Chicago
- Month: January
- Product: Laptops, Tablets, Phones
4. Dice Operation
Dice selects two or more dimensions to create a sub-cube by fixing values for those dimensions.
Selection on two or more dimension of the given cube, resulting in a sub cube.
Example: If we want to analyze sales data for January and February in New York and Los Angeles, we perform a dice operation.
Below Data Before Dice:
- City: Sales in New York, Los Angeles, Chicago
- Month: January, February, March
- Product: Laptops, Tablets, Phones
Below Data After Dice:
- City: Sales in New York, Los Angeles
- Month: January, February
- Product: Laptops, Tablets, Phones
