1. PCI-DSS (Payment Card Industry Data Security Standard)
What it is:
PCI-DSS is a global security standard for any business that stores, processes, or transmits credit or debit card data.
“Protecting credit/debit card data during storage, processing, and transmission.”
Who must comply:
- Online stores
- Banks
- Payment gateways
- SaaS platforms that handle payments
- Any company accepting Visa, Mastercard, Amex, etc.
What it protects:
Card numbers, CVV, expiration dates, and transaction data.
Key requirements include:
- Encrypting card data
- Restricting access to payment systems
- Regular security scans and penetration testing
- Secure network and firewall configurations
- Logging and monitoring access
Why it matters:
Without PCI-DSS, customer card data can be stolen, leading to fraud, chargebacks, fines, and brand damage.
2. SOC 2 (Service Organization Control 2)
What it is:
SOC 2 is a compliance framework that proves a company protects customer data in cloud and SaaS environments.
Controls for service organizations (especially cloud/SaaS) on Security, Availability, Processing Integrity, Confidentiality, and Privacy (Trust Services Criteria)
Who needs it:
- SaaS companies
- Cloud platforms
- Fintech apps
- Data platforms
- B2B software providers
SOC 2 evaluates five trust principles:
- Security
- Availability
- Processing integrity
- Confidentiality
- Privacy
What it checks:
- How you secure customer data
- How you manage system uptime
- How access is controlled
- How incidents are handled
- How data is stored and deleted
Why it matters:
SOC 2 is often required before enterprise clients will sign a contract. It proves your company is enterprise-grade and trustworthy.
3. GDPR (General Data Protection Regulation)
What it is:
GDPR is a European data privacy law that protects the personal data of people in the EU.
Protecting personal data and privacy rights of EU residents.
Who must follow it:
Any company worldwide that collects or processes data from EU residents.
What counts as personal data:
- Name
- IP address
- Location
- Browsing behavior
- Any data that can identify a person
Key GDPR rights:
- Right to access
- Right to delete
- Right to correct
- Right to know how data is used
- Right to withdraw consent
What companies must do:
- Collect only necessary data
- Get clear user consent
- Secure stored data
- Report breaches
- Allow users to delete their data
Why it matters:
GDPR violations can lead to fines of up to 4 percent of global revenue and massive loss of customer trust.
4. HIPAA (Health Insurance Portability and Accountability Act)
What it is:
HIPAA is a US law that protects medical and health information.
Safeguarding sensitive Protected Health Information (PHI).
Who must comply:
- Hospitals
- Clinics
- Insurance companies
- Health apps
- Healthcare SaaS platforms
What it protects:
Patient data such as
- Medical records
- Diagnoses
- Prescriptions
- Test results
- Billing information
This data is called PHI (Protected Health Information).
Key requirements:
- Secure storage of patient data
- Access controls
- Audit trails
- Data encryption
- Breach reporting
Why it matters:
Healthcare data is extremely sensitive. HIPAA ensures privacy, safety, and patient trust.
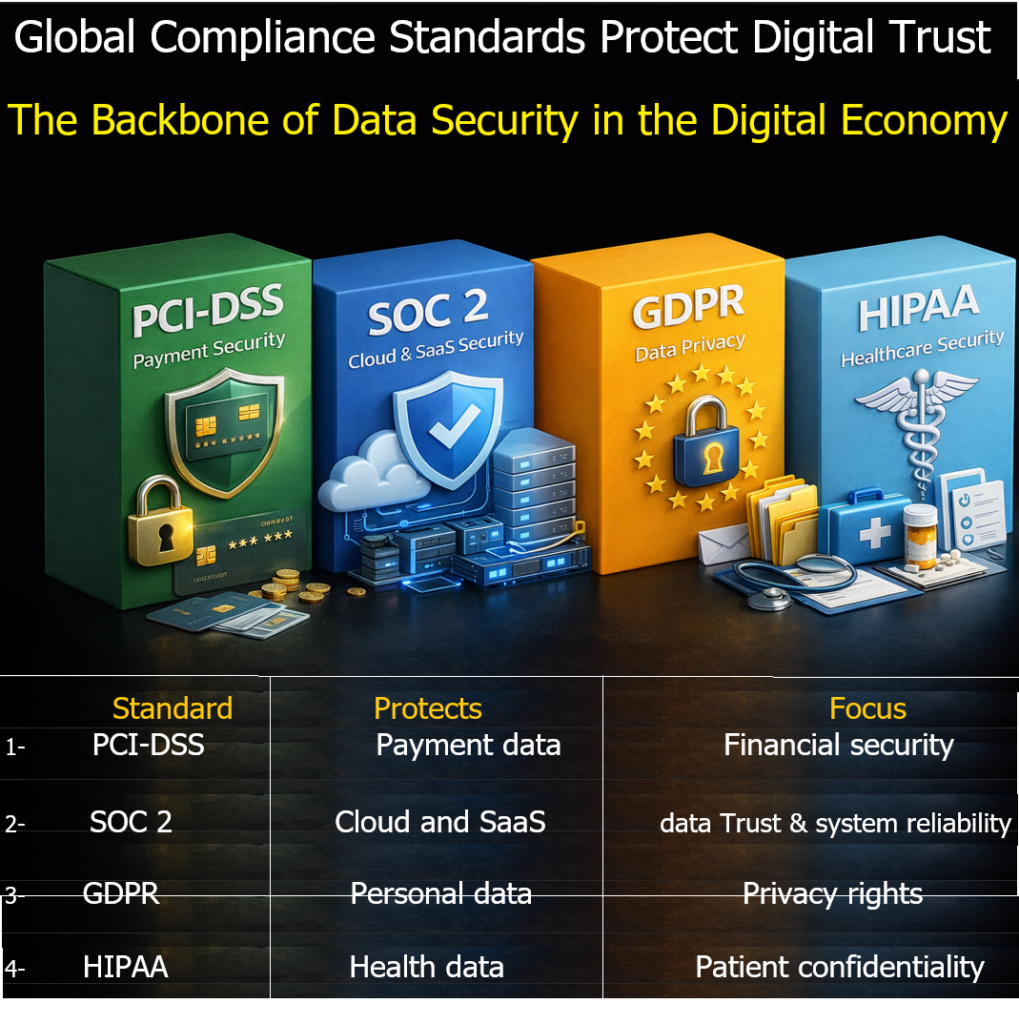
How These Four Work Together
| Standard | Protects | Focus |
|---|---|---|
| PCI-DSS | Payment data | Financial security |
| SOC 2 | Cloud and SaaS data | Trust and system reliability |
| GDPR | Personal data | Privacy rights |
| HIPAA | Health data | Patient confidentiality |
A modern digital company may need all four depending on its industry.