The following things need to be followed
Step [1] – Before Pivot Table Ensure Your Data Correct Format
Ensure your data is structured correctly.
- Format: Use a table or list format with clear headers in the first row.
- No Blank Rows/Columns: Ensure there are no empty rows or columns within the dataset.
- Consistent Data: Data should be consistent (e.g., dates in one column, numbers in another).

Step [2] –
[2.1] – Select the Data: Highlight the entire dataset (including headers).

[2.2] – Go to “Insert” Tab: Click on the “Insert” tab in Excel.

[2.3] – Choose Pivot Table:
- Click on “Pivot Table” in the Tables group.

[2.4]- Select Pivot Table Location:
- New Worksheet: Places the Pivot Table in a new sheet. or
- Existing Worksheet: Allows you to specify the location.
Note:: For best result always try to select New Worksheet
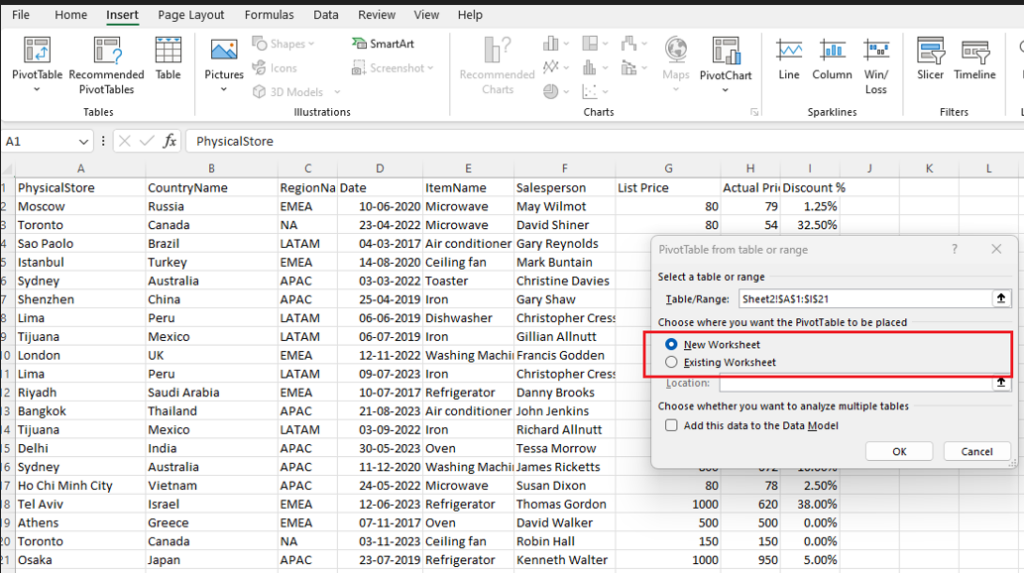
[2.5] – Click “OK.”
Step [3] – Build the Pivot Table
Filters (Optional): Add a field to the Filters area to filter data dynamically.
A blank Pivot Table field list appears.
Drag and Drop Fields:
Rows: Drag a categorical field (e.g., Physical store, Country Name) into the “Rows” area.
Values: Drag a numerical field (e.g., List Price, Actual Price) into the “Values” area.
Columns (Optional): Drag another field (e.g., Date) to see data across columns.
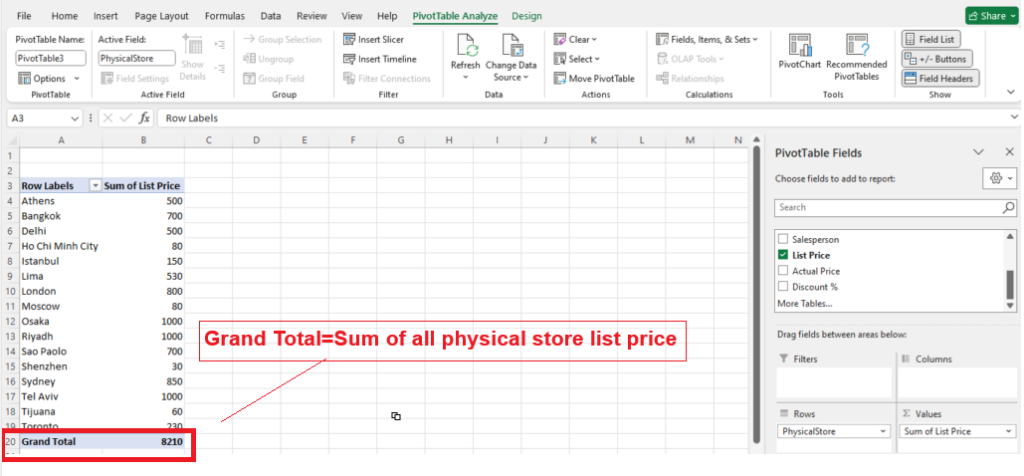
Step [4] – Physical Store in Rows & List Price in Values, by default List Price display sum of list price corresponding to physical store.
[4.1] – Grand Total = Sum of all Physical Store List Price
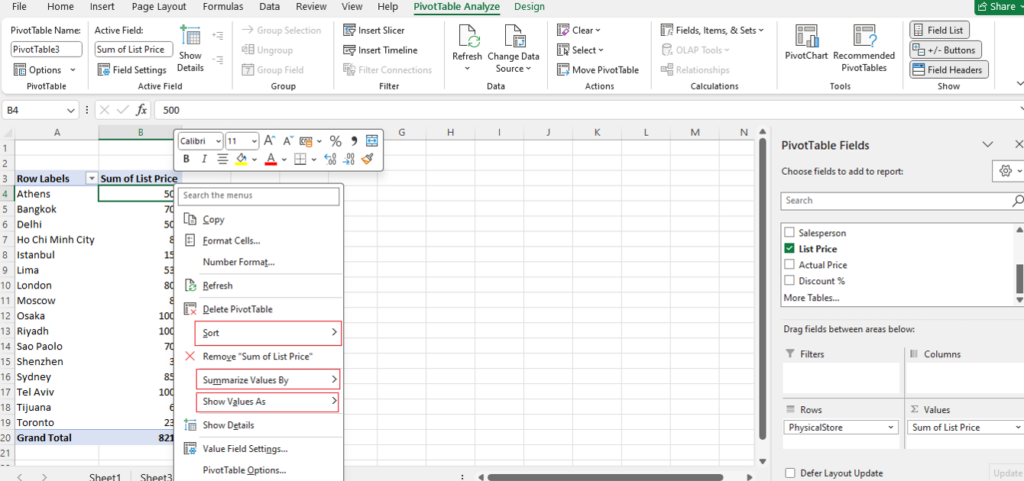
[4.2] – Right Click any of (rows) Numeric value of (Sum of List Price)–>display
- Sort
- Summarize Values By
- Show Values At
[4.3] – Summarize Values By
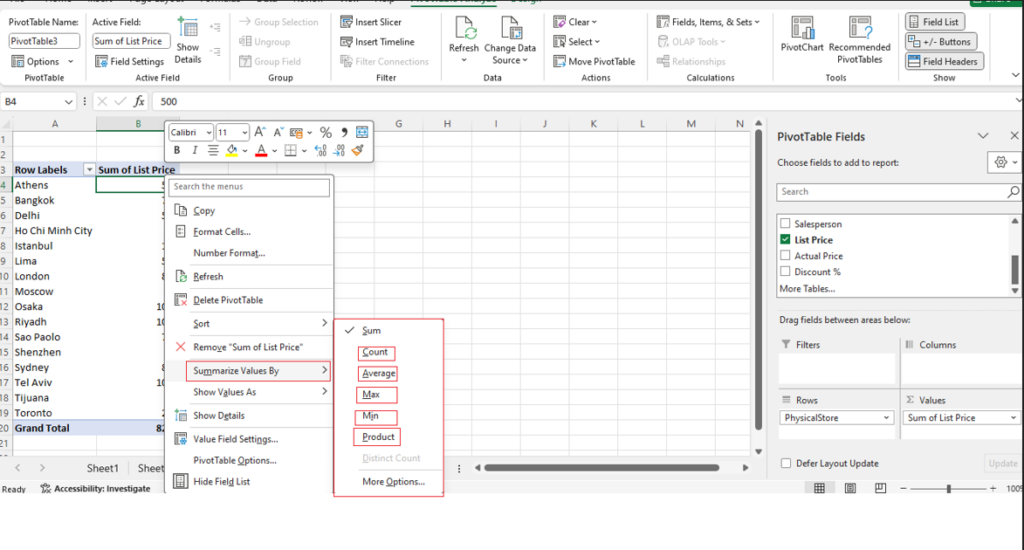
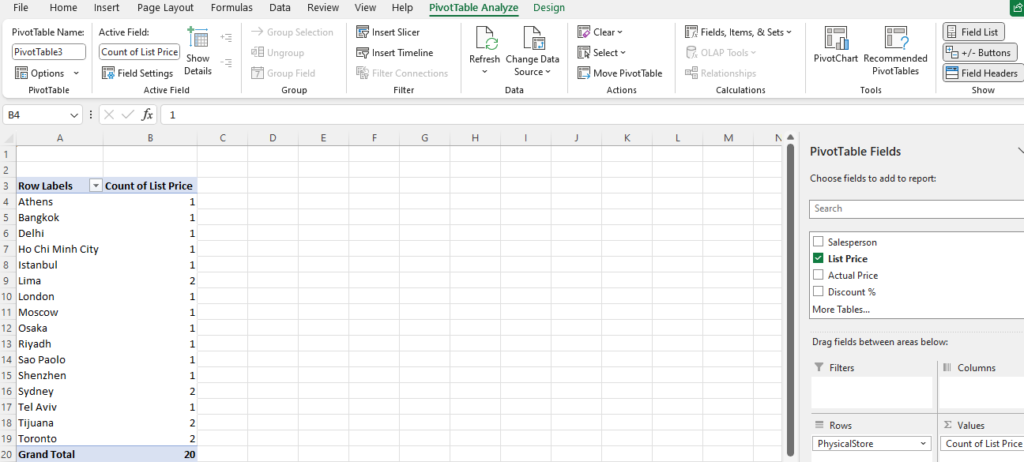
[a] – If Select Summarize Values By –> Count , result as
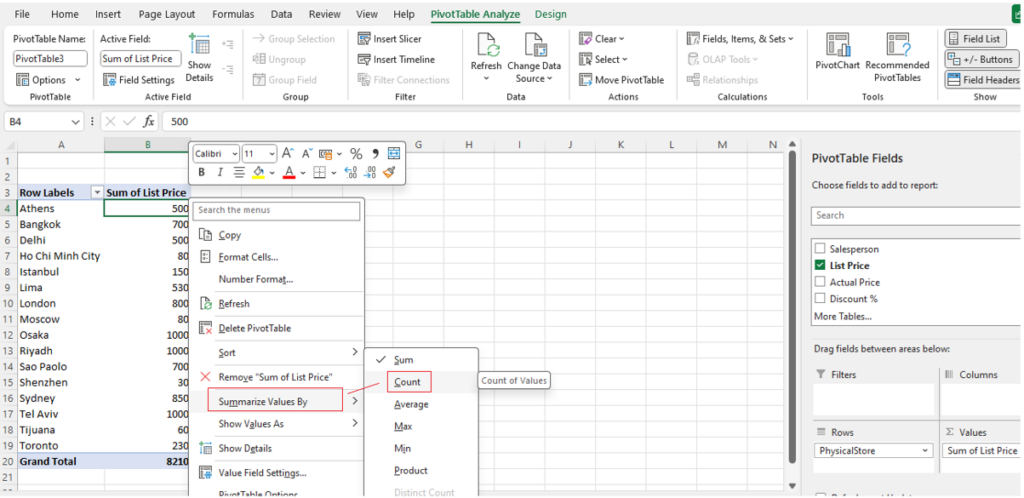
[b] – If Select Summarize Values By –> Average , result as
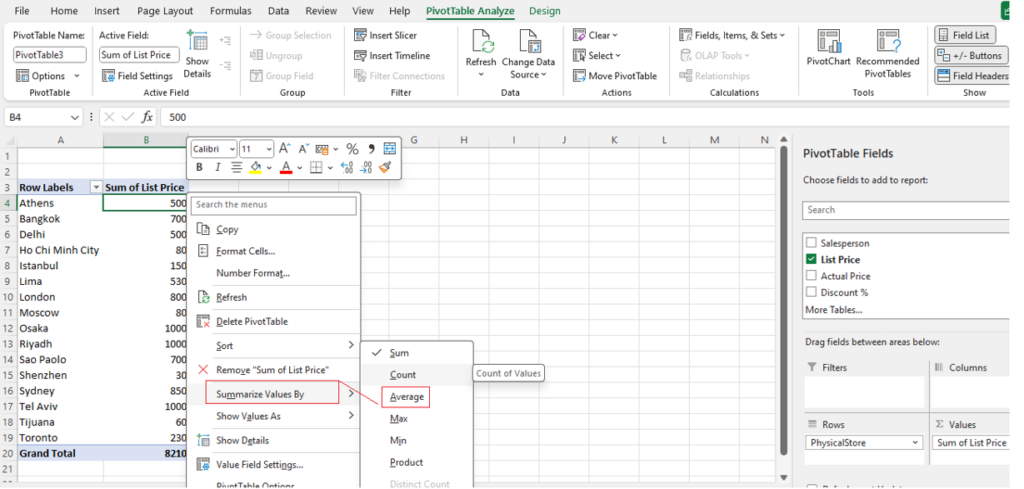
Once Select — Summarize Values By –> Average
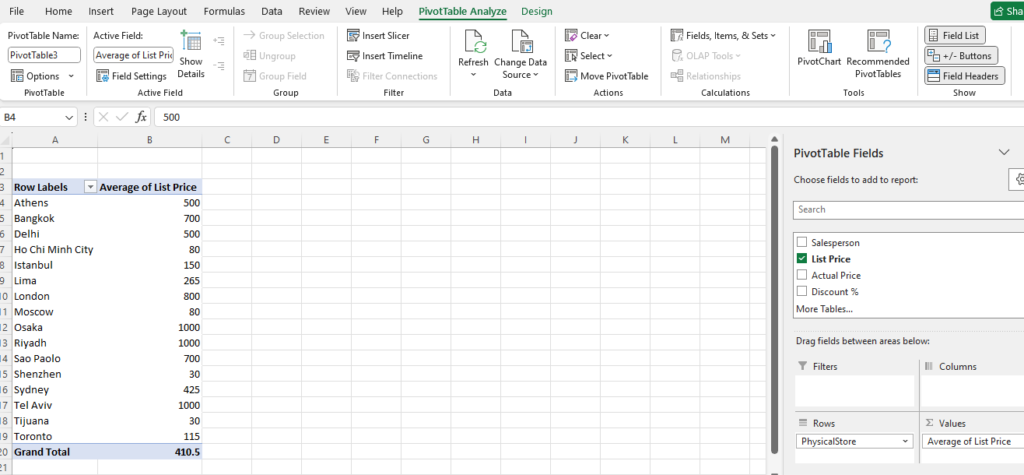
[c] – If Select Summarize Values By –> Max , result as

Once Select — Summarize Values By –> Max
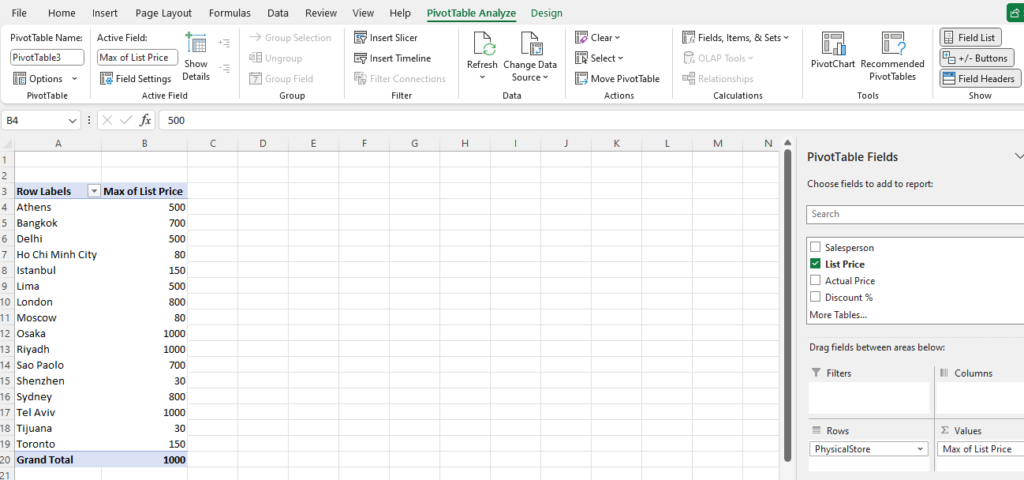
[d] – If Select Summarize Values By –> Min , result as

Once Select — Summarize Values By –> Min
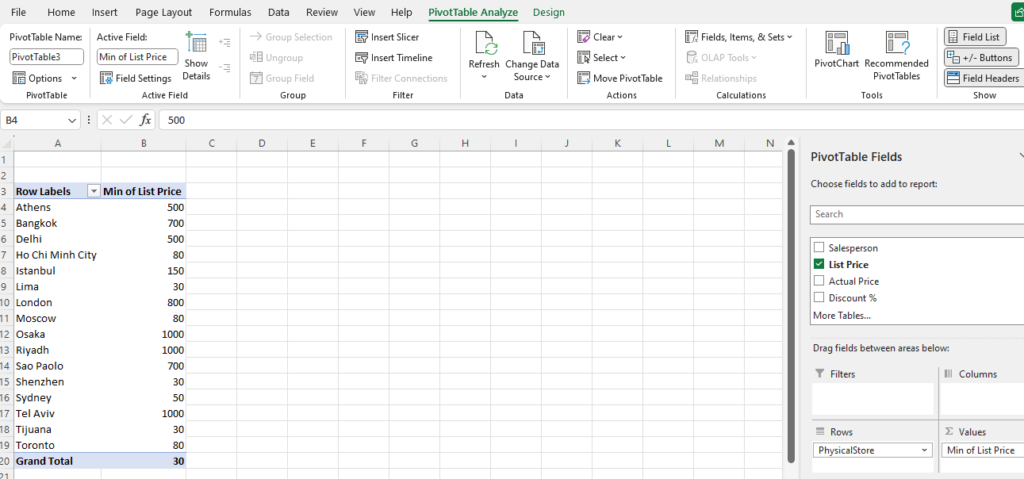
[4.4] – Show Values As
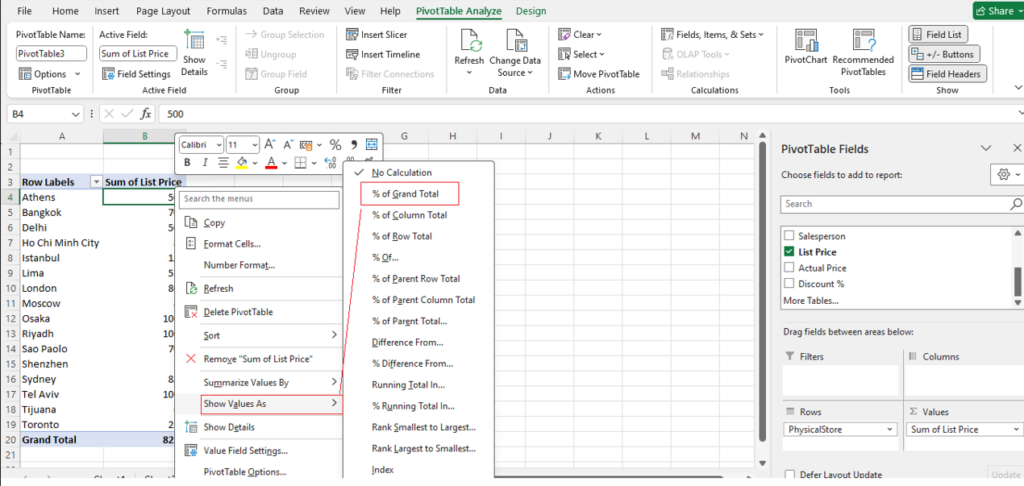
–Once Select — Show Values As –> % of Grand Total
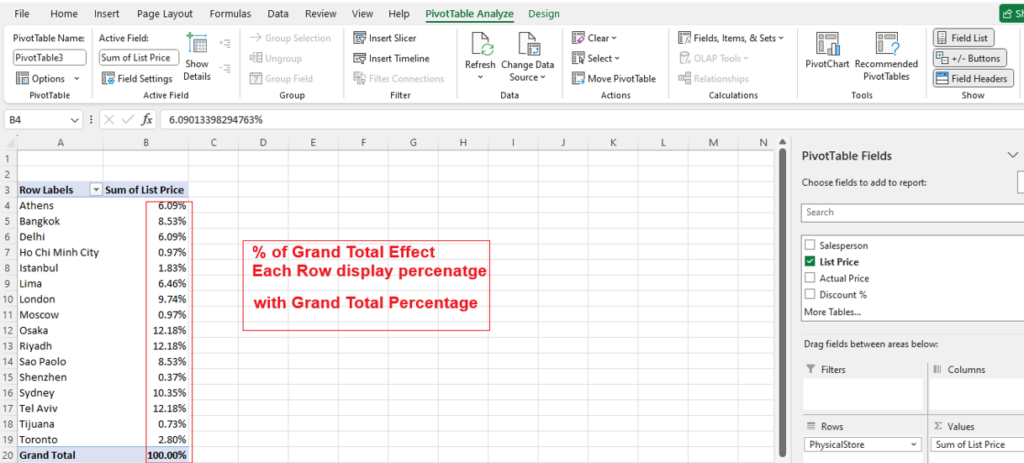
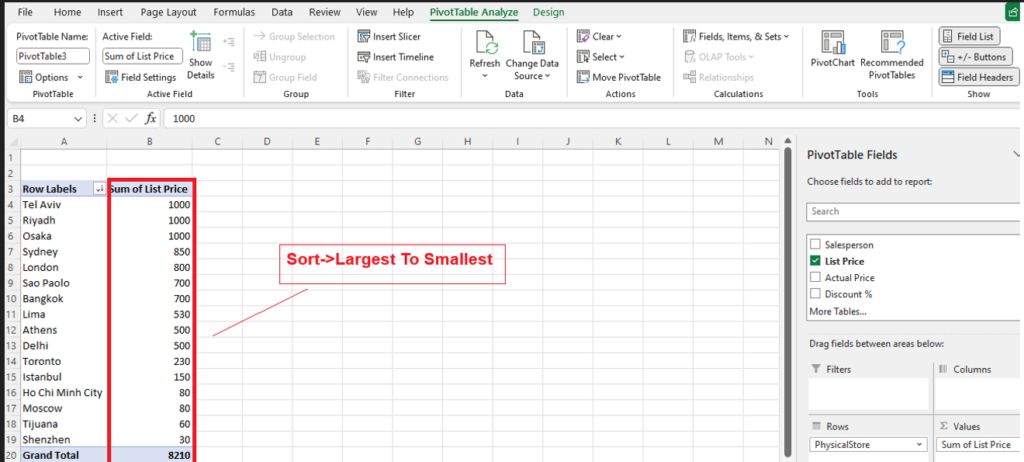
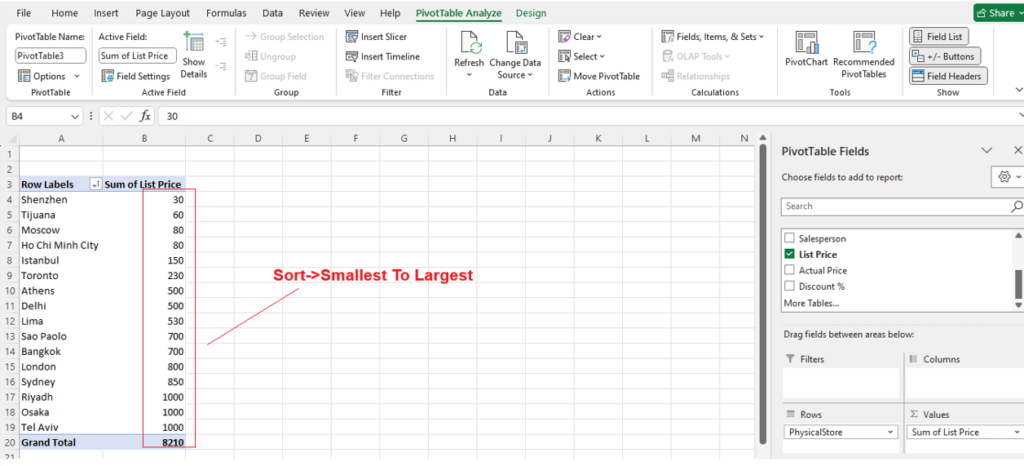
[4.5] – Sort->Smallest To Largest or Sort->Largest To Smallest
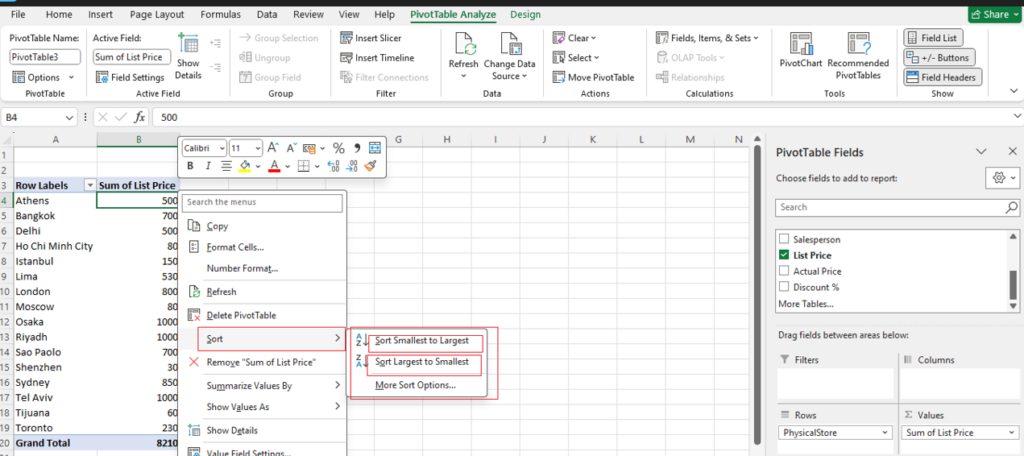
[a] Sort->Smallest To Largest result
[b] Sort->Largest To Smallest result
