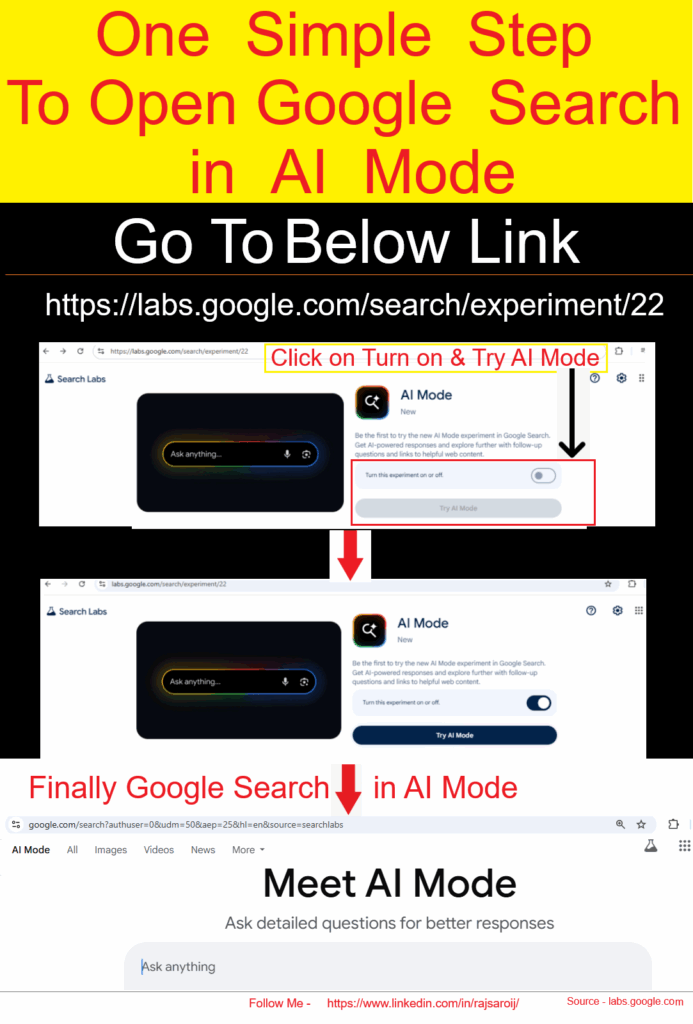
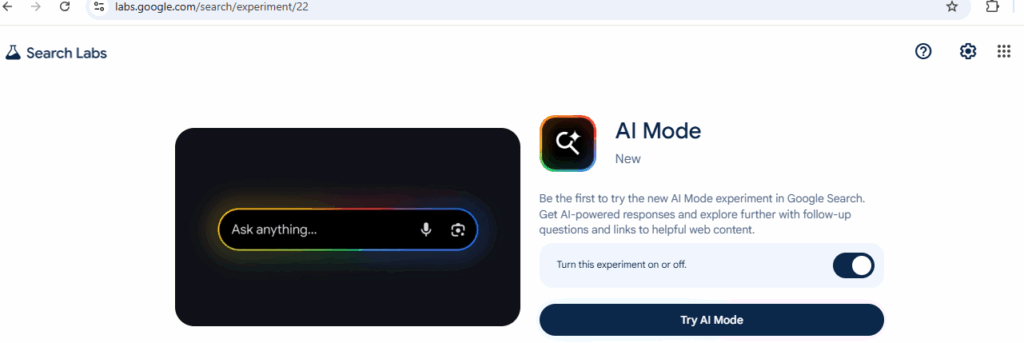
The following steps to open Google Search in AI Mode
Step [1] – Go to labs.google.com
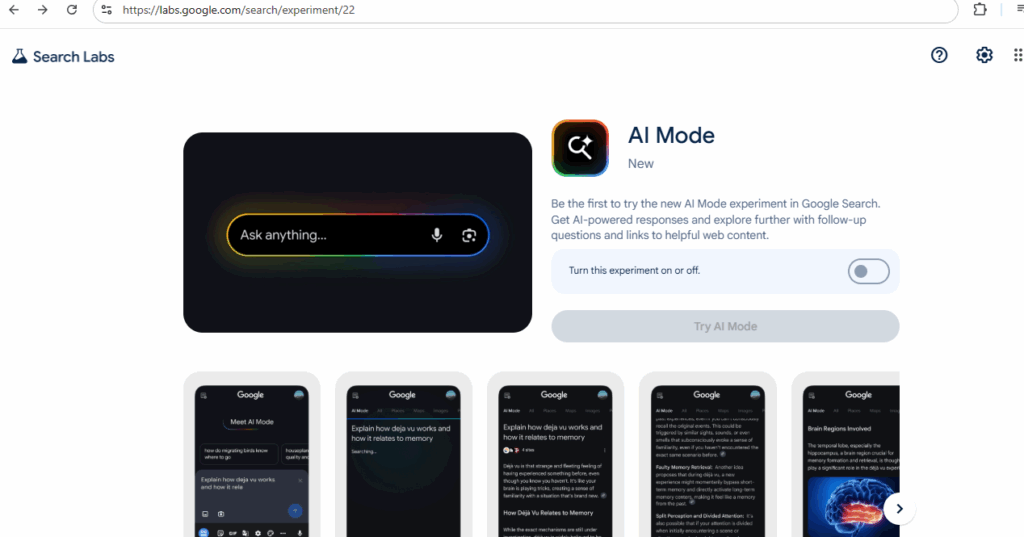
Step [2] – Look for “AI Mode” and switch it ON
Go To https://labs.google.com/search/experiment/22
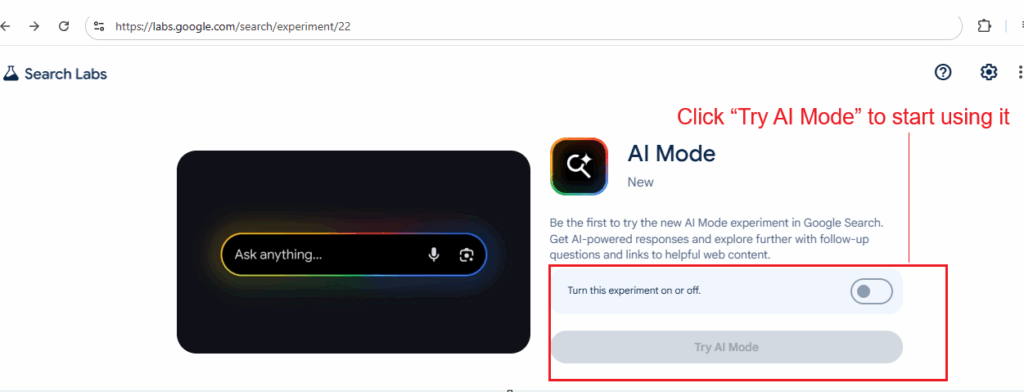
Step [3] – Click “Try AI Mode” to start using it
Once Done –
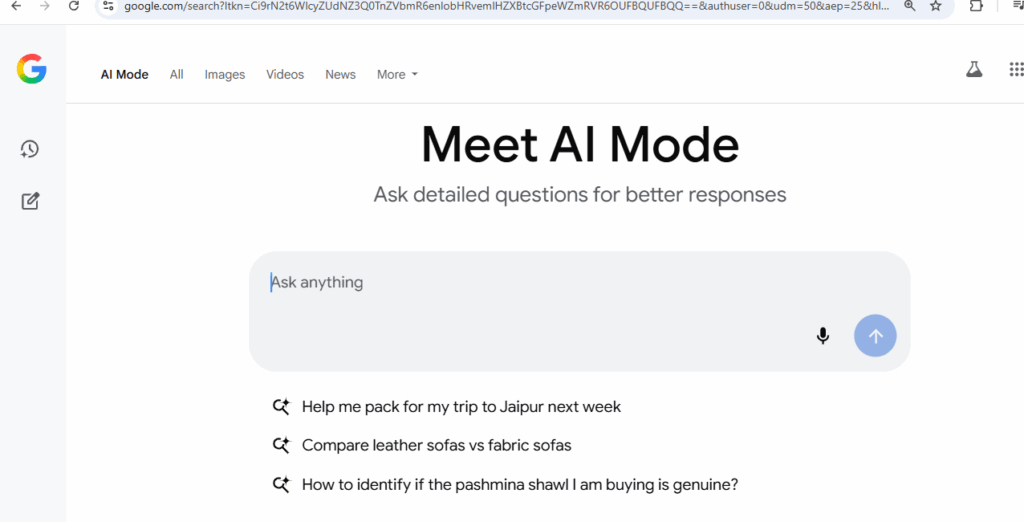
Step [4] – Or just search something on Google and tap the AI Mode tab at the top
Google’s AI Mode makes searching easier, smarter, and faster — whether you’re planning meals, learning something new, or exploring hobbies. It’s now available to all users in India who use English on their device.
Step [5] – Ask Using Voice or Photos
You don’t always have to type. Just:
Upload a photo for visual searches (like spices, clothes, books, etc.)
Tap the microphone to ask your question
Step [6] – How Does Google AI Mode Work?
Google uses a “query fan-out technique” — this means the AI breaks your big question into smaller ones, searches them all together, and gives you one useful, combined answer. It also uses tools like:
Knowledge Graph (for facts)
Shopping search (for product suggestions)
Lens support (for image-based questions)
So if you take a photo of a spice and ask,
“What is this spice and how can I use it in cooking?”
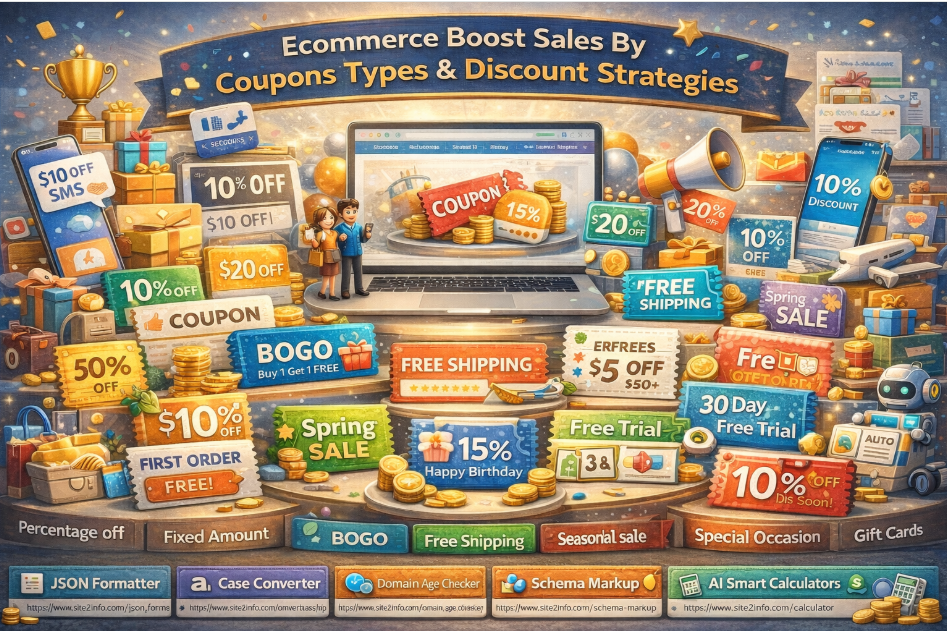
Ecommerce Boost Sales by Coupon Types & Discount Strategies
In today’s competitive digital commerce landscape, discounts and coupons are not just offers — they are strategic growth tools. When implemented correctly, coupon strategies can significantly increase sales, conversions, average order value (AOV), and customer retention.
Below are the most effective eCommerce coupon types and discount strategies that businesses use to boost sales and customer engagement.
1️⃣ Percentage-Off Discounts
Example: 10% OFF, 25% OFF
Percentage-based discounts are one of the most popular and easy-to-understand offers for customers.
Best used for:
Storewide promotions
Seasonal sales
Flash deals
Benefits:
Simple and attractive
Works well across all price ranges
Encourages impulse purchases
2️⃣ Fixed-Amount Discounts
Example: $10 OFF, $50 OFF
Fixed discounts offer a clear and direct value, especially effective for higher-priced products.
Best used for:
High-value carts
Minimum purchase thresholds
Benefits:
Perceived as high value
Controls discount cost better than percentages
3️⃣ Buy One Get One (BOGO)
Example: Buy 1 Get 1 Free / Buy 1 Get 50% Off
BOGO deals are extremely effective in increasing cart size and clearing inventory.
Best used for:
Overstocked items
Fast-moving consumer goods
Benefits:
Boosts order volume
Encourages customers to buy more
4️⃣ Free Shipping
Shipping costs are a top reason for cart abandonment.
Best used for:
Minimum cart value offers
First-time purchases
Benefits:
Reduces checkout friction
Increases conversion rates significantly
5️⃣ Seasonal & Festive Sales
Examples: Black Friday, Diwali Sale, Christmas Sale
Seasonal discounts align with customer buying psychology during festivals and holidays.
Benefits:
High traffic and intent
Strong emotional connection
Predictable sales spikes
6️⃣ Cart Deals (Cart Value Discounts)
Example: Get $20 OFF on orders above $200
Benefits:
Increases Average Order Value (AOV)
Encourages customers to add more items
7️⃣ First-Time Buyer Discounts
Example: 10% OFF on your first order
Benefits:
Reduces hesitation for new users
Improves first conversion rate
8️⃣ Loyalty Points & Rewards
Reward returning customers with points redeemable for discounts or free products.
Benefits:
Improves customer retention
Builds long-term brand loyalty
9️⃣ Referral Coupons
Offer rewards to both the referrer and the new customer.
Benefits:
Low-cost customer acquisition
Builds trust through word-of-mouth
🔟 Special Occasion Discounts
Examples: Birthday offers, anniversary discounts
Benefits:
Personalized customer experience
Strengthens emotional connection
1️⃣1️⃣ Gift Cards
Gift cards act as prepaid revenue and future conversion drivers.
Benefits:
Guaranteed upfront revenue
Encourages repeat visits
1️⃣2️⃣ Free Trials
Allow customers to try products or services before committing.
Benefits:
Reduces purchase risk
Builds confidence in your product
1️⃣3️⃣ Membership Discounts
Exclusive discounts for registered or paid members.
Benefits:
Encourages account creation
Builds a premium customer base
1️⃣4️⃣ Affiliate Coupons
Offer special coupons through affiliate partners.
Benefits:
Performance-based marketing
Expands reach with minimal risk
1️⃣5️⃣ Exit-Intent Offers
Display offers when a user is about to leave the site.
Benefits:
Reduces cart abandonment
Captures lost conversions
1️⃣6️⃣ Retargeted Promotions
Show personalized offers to returning visitors.
Benefits:
Higher relevance
Better conversion rates
1️⃣7️⃣ SMS Coupons
Send coupons directly to customers via text message.
Benefits:
High open rates
Instant engagement
1️⃣8️⃣ Automated Coupons
Coupons triggered by actions like signup, inactivity, or abandoned carts.
Benefits:
Scalable and efficient
Reduces manual effort
1️⃣9️⃣ Quantity Discounts
Example: Buy 5 items and get 10% OFF
Benefits:
Encourages bulk purchases
Ideal for B2B and wholesale
2️⃣0️⃣ Payment Method-Based Coupons
Offer discounts for specific payment methods (UPI, Wallets, Cards).
Benefits:
Reduces transaction costs
Encourages preferred payment channels
2️⃣1️⃣ Location-Based Coupons
Target offers based on customer geography.
Benefits:
Localized marketing
Region-specific promotions
2️⃣2️⃣ Scheduled Coupons
Coupons active only during specific dates or time windows.
To maximize impressions and attract more users to your LinkedIn post, you need to combine content quality with smart engagement strategies and timing. Here’s a step-by-step guide:
✅ 1. Write Strong, Relevant Content
Hook in the first 2 lines: Only the first 3 lines are visible before “…see more.” Make it compelling.
Value-driven: Share insights, quick tips, stats, stories, or lessons learned.
Originality wins: Avoid generic content. Personal experience, case studies, or unique opinions work best.
1 branded or community-based (#YourCompany, #GrowthHackers)
✅ 3. Use Engaging Formats
Text-only posts with line breaks = better readability
Carousel/Document posts (PDFs) = high engagement
Short native videos (with captions) = strong visual pull
Polls = high reach due to engagement algorithm
Images with real people (you or your team) = more relatable
✅ 4. Post Timing
Best time to post:
Weekdays: Tuesday–Thursday
Time: Between 8 AM–11 AM and 4 PM–6 PM (local audience time)
✅ 5. Engage Immediately After Posting
Reply to every comment within 60 minutes (LinkedIn’s “golden hour”).
Tag people relevant to the topic — but don’t over-tag.
Ask a question at the end of your post to invite comments.
✅ 6. Build Relationships
Comment thoughtfully on others’ posts before and after you post.
Be active with your network consistently (likes + value-adding comments = visibility).
✅ 7. Optimize Your Profile
People who see your post often click your profile.
Make sure your headline, photo, and banner clearly communicate who you are and what you do.
✅ 8. Avoid These Mistakes
Don’t include external links in the post. If needed, put links in the first comment.
Don’t use too many hashtags (3–5 max).
Don’t use “engagement bait” like “Comment ‘Yes’ if you agree” – it may be flagged.
Bonus: Use Emojis, Bullets, and Formatting
Break content with emojis (👍 💡 🚀) and short paragraphs to make it skimmable.
Example Post Structure:
pgsqlCopyEdit🔥 The #1 reason most professionals fail to grow on LinkedIn?

They post for themselves — not for their audience.

Here’s how to flip the script 👇

✅ Share lessons, not just wins
✅ Ask questions that spark real conversations
✅ Be consistent — even when the likes don’t come

What’s worked best for you on LinkedIn?

Let’s learn together. Drop your tips 👇

#LinkedInGrowth #PersonalBranding #SocialSelling #CareerTips
Definition of White-collar jobs: It refer to professional, managerial, or administrative work typically performed in an office or remote setting. These jobs usually require mental skills, education, and problem-solving abilities, rather than manual labor.
Example: Common White-Collar Job
Software developers
Accountants and financial analysts
Marketing managers
Lawyers and legal consultants
Teachers, professors, researchers
HR professionals
IT support and system administrators
Data analysts
Are White-Collar Jobs Affected by AI?
Yes, AI is transforming many white-collar roles.
How AI Is Impacting White-Collar Jobs:
[1] – Automation of Repetitive Tasks
Tools like ChatGPT, Copilot, and automation bots can draft emails, summarize documents, and even generate reports.
[2] – Data Analysis & Decision-Making
AI helps in faster and smarter data interpretation, replacing manual data crunching.
[3] – Customer Support & Communication
AI chatbots and voice assistants are reducing the need for human support agents.
[4] – Coding & Software Development
AI-assisted coding is speeding up development work and even writing code from prompts.
[5] – Creative Fields
Designers, content creators, and marketers are seeing AI tools assist or sometimes replace parts of their workflows.
AI data centers are pivotal for modern computational tasks but demand significant resources due to their operational and structural needs.
AI data centers require significantly more resources than traditional data centers due to the unique demands of AI workloads, particularly those involving machine learning (ML) and large-scale model training and inference.
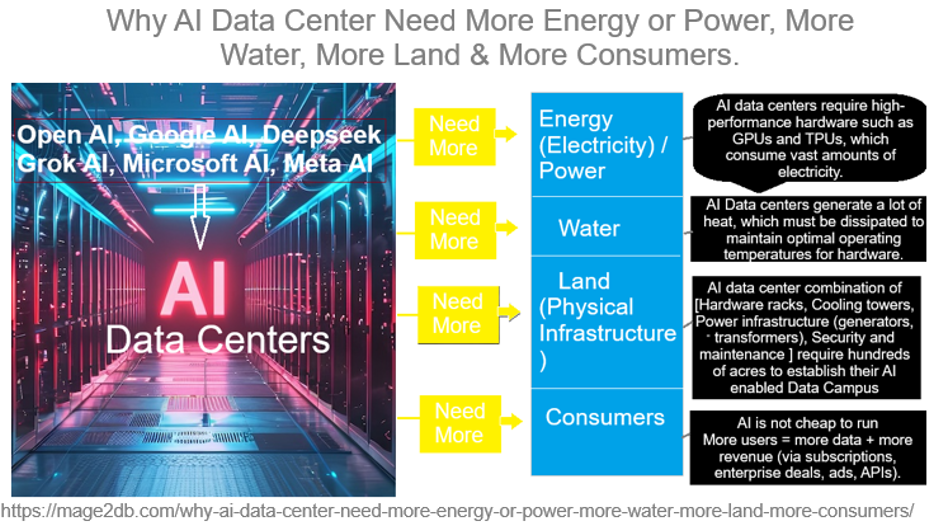
The following below steps define why AI Data Center need more Energy or Power, more Water, more Land, more consumers
Step [1] – Why Need More Energy(Electricity) / Power:
AI Algorithms workloads, especially training large models like those used for generative AI, Agentic AI, deep learning , neural networks, LLM are computationally intensive. These tasks require high-performance hardware such as GPUs and TPUs, which consume vast amounts of electricity.
AI models grow in complexity and scale, so does their energy demand.
High-Performance Computing (HPC)AI models (ChatGPT, Gemini, Grok, etc.): require massive GPUs/TPUs that consume substantial electricity clusters (e.g., NVIDIA H100s) to process and serve queries.
Training large models: consumes millions of GPU hours and vast power.
24/7 Operations: also needs constant power to keep hardware running 24/7.
Scalability: As models grow (e.g., trillion-parameter networks), energy needs rise exponentially, outpacing efficiency gains
Step [2] – Why Need More Water:
Cooling is critical for AI data centers, as the servers generate immense heat, especially in water-cooled data centers.
AI Data centers generate a lot of heat, which must be dissipated to maintain optimal operating temperatures for hardware.
Direct Cooling: Evaporative cooling towers and chilled water systems use millions of gallons annually. For example, a 15 MW data center can use up to 360,000 gallons daily.
Location Challenges:Data centers in arid regions (e.g., Arizona) strain local water resources, prompting regulatory scrutiny.
Indirect Usage: Energy production (e.g., thermoelectric power plants) often relies on water, linking energy demand to water scarcity.
For Example:: A single data center can use millions of gallons of water annually—Google’s data centers, for instance, used 5.2 billion gallons in 2023, a number likely higher now with AI expansion.
Step [3] –Why Need More Land(Physical Infrastructure ):
The scale of AI data centers is massive. The house thousands of servers, cooling systems, and backup power systems, requiring large physical spaces.
AI data center combination of [Hardware racks, Cooling towers, Power infrastructure (generators, transformers), Security and maintenance ] require hundreds of acres to establish their AI enabled Data Campus
For example: Microsoft AI, Open AI Google Gemini AI, Grok AI, Meta, Amazon AI are building AI Campus on hundreds of acres of AI-focused data campuses hundreds of thousands of square feet. As AI demand grows, companies need more land to build new facilities or expand existing ones, often in rural areas with cheaper land and power access.
Step [4] – Why Need More Consumers:
The more consumers and businesses use AI services—whether for cloud computing, generative AI applications, or enterprise solutions—the more data centers need to scale.
Revenue Model: Subscription-based AI services ( ChatGPT Plus, Grok, DeepSeek, Meta ) rely on scaling users to offset high operational costs.
Data Feedback Loop: More users generate more data, improving models (e.g., recommendation systems), which attracts more users.
AI is not cheap to run, so companies need scale to justify infrastructure.
More users = more data + more revenue (via subscriptions, enterprise deals, ads, APIs).
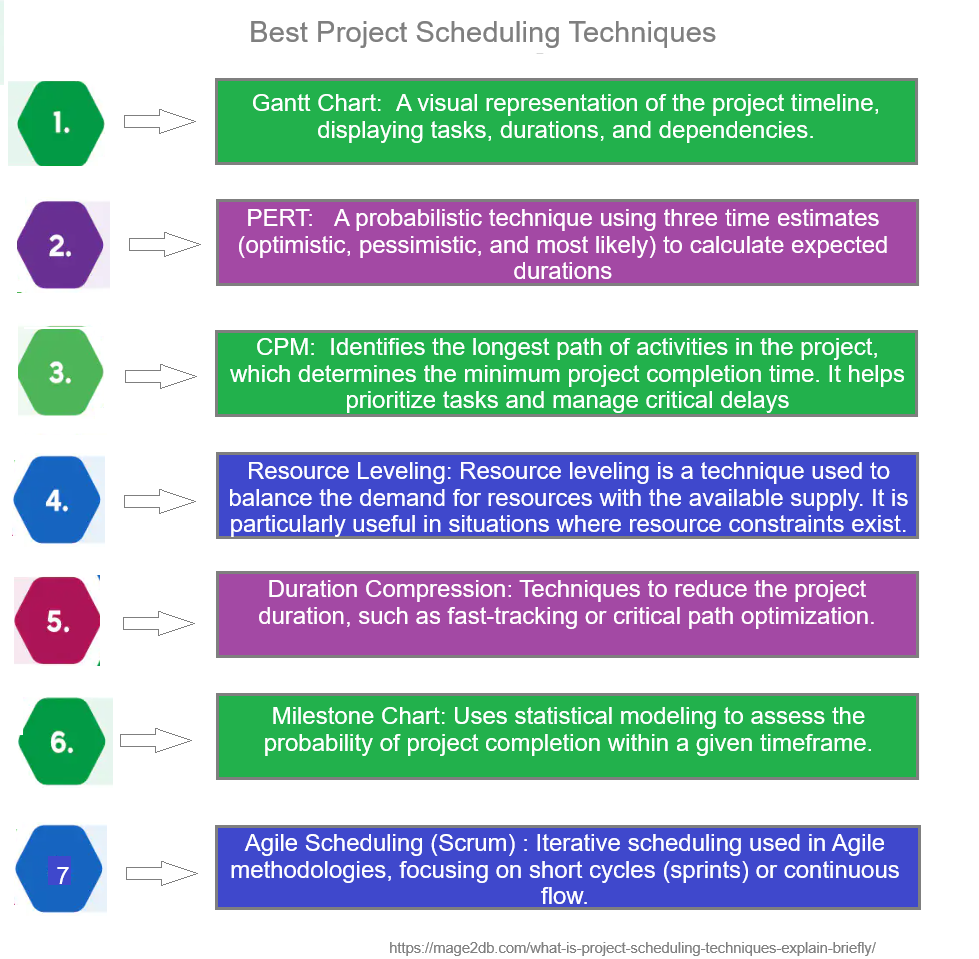
Project Scheduling Techniques:: These are methods used to plan, organize, and control tasks within a project to ensure timely completion. These techniques help project managers allocate resources efficiently, identify dependencies, and track progress.
The following below best Project Scheduling Techniques-
[1] – Gantt Chart: A visual representation of the project timeline, displaying tasks, durations, and dependencies. It helps visualize the project schedule and track progress.
Gantt Chart Features:
Easy to read and understand.
Shows overlapping tasks.
Useful for tracking progress against the timeline.
[2] – Program Evaluation and Review Technique (PERT): A network-based method that uses probabilistic estimates for task durations, allowing for contingency planning.
Program Evaluation and Review Technique (PERT) Features:
Uses three time estimates (optimistic, pessimistic, and most likely) to calculate an expected duration for each task.
Focuses on time management rather than costs.
Suitable for R&D projects where timelines can be unpredictable.
[3] – Critical Path Method (CPM): Identifies the longest path of activities in the project, which determines the minimum project completion time. It helps prioritize tasks and manage critical delays..
Critical Path Method (CPM)Features
Identifies the longest stretch of dependent activities and measures the time required to complete them.
Helps in determining the minimum completion time for the project.
Critical tasks must be monitored closely as they affect the project completion date.
[4] – Resource Leveling: Resource leveling is a technique used to balance the demand for resources with the available supply. It is particularly useful in situations where resource constraints exist.
Resource Leveling Features:
Helps to minimize resource over-allocation. Can extend the project duration to ensure resources are not overused. Provides a more realistic timeline for project completion.
[5] – Duration Compression: Techniques to reduce the project duration, such as fast-tracking or critical path optimization.
[6] – Milestone Chart: Uses statistical modeling to assess the probability of project completion within a given timeframe.
Milestone Chart Features:
Marks critical points like project start, phase completion, or product launch.
Often used alongside Gantt charts for high-level tracking.
Helps stakeholders focus on significant achievements.
[7] – Agile Scheduling (Scrum) : Iterative scheduling used in Agile methodologies, focusing on short cycles (sprints) or continuous flow.
Agile Scheduling (Scrum) Features:
Used in flexible, iterative projects (e.g., software development). Work is divided into sprints (short cycles) with daily stand-up meetings.
Predictable Projects, (CPM or Gantt) works best.
While Uncertain Projects, (PERT/Agile) is better.
Choosing the right scheduling technique depends on: ✅ Project complexity ✅ Deadline constraints ✅ Resource availability ✅ Level of uncertainty
Phishing attacks are a type of cyberattack where attackers impersonate legitimate entities (e.g., banks, companies, or individuals) to trick users into providing sensitive information, such as login credentials, credit card details, or personal data, or to perform actions like clicking malicious links or downloading malware. These attacks typically exploit human psychology, using urgency, fear, or trust to manipulate victims.
Phishing is one of the most common cyber threats, accounting for a significant portion of data breaches. According to recent reports, phishing emails make up around 90% of successful cyberattacks, with businesses and individuals losing billions annually.
How Phishing Attacks Work
[1] – Delivery: Attackers send fraudulent communications, often via:
Email (most common)
SMS (smishing)
Phone calls (vishing)
Social media or messaging apps
[2] – Deception: The message appears to come from a trusted source, using spoofed email addresses, logos, or phone numbers.
[3] – Manipulation: The message prompts the victim to:
Share sensitive information (e.g., passwords, bank details)
Click a malicious link leading to a fake website or malware
Open an infected attachment
[3] – Exploitation: Once the victim complies, attackers steal data, install malware, or gain unauthorized access to systems
Example of a Phishing Attack
Scenario: Fake Bank Email
Delivery: You receive an email that appears to be from your bank, with the subject line: “Urgent: Your Account Has Been Compromised!”
Deception: The email uses the bank’s logo, a professional tone, and an email address like “support@bankname-security.com” (spoofed to look legitimate).
Manipulation: The email claims your account is at risk and urges you to click a link to “verify your identity” or “reset your password.” The link directs to a fake website mimicking the bank’s login page.
Exploitation: When you enter your username and password, the attackers capture your credentials. They may also install malware via the website or prompt you to download a “security update” (actually a virus).
Scenario Real-World Example: In 2023, a phishing attackers targeted PayPal users with emails claiming their accounts were limited. Victims were directed to a fake PayPal login page, leading to thousands of stolen credentials and financial losses.
Types of Phishing Attacks
[1] – Email Phishing: Mass emails pretending to be from trusted organizations.
[2] – Spear Phishing: Targeted attacks aimed at specific individuals or organizations, using personalized details (e.g., referencing your name or job role).
[3] – Whaling: Phishing aimed at high-profile targets like executives or CEOs.
[4] – Smishing: Phishing via SMS, often with urgent prompts to click links.
[5] – Vishing: Voice-based phishing using phone calls or voicemails.
[6] – Clone Phishing: Duplicating a legitimate email but replacing links or attachments with malicious ones.
[7] – Business Email Compromise (BEC): Attackers impersonate executives to trick employees into transferring money or sharing data.
Urgency or Threats: Be wary of messages demanding immediate action (e.g., “Your account will be locked in 24 hours!”).
Generic Greetings: Legitimate organizations often use your name, not “Dear Customer.”
Spelling/Grammar Errors: Poor language can indicate a scam.
Unusual Requests: Be cautious of unexpected requests for sensitive information or money transfers.
2. Verify Before Acting
Hover Over Links: Check the URL before clicking (hover without clicking to see the real destination). Avoid shortened URLs (e.g., bit.ly).
Contact Directly: Use official contact details (e.g., from the company’s website) to verify the message, rather than replying to the email or calling numbers provided in the message.
Check Website Security: Ensure websites use “https://” and have a valid SSL certificate (padlock icon). Avoid entering data on unsecured sites.
3. Use Technology-Based Protections
Email Filters: Enable spam and phishing filters in your email client (e.g., Gmail, Outlook) to block suspicious emails.
Antivirus Software: Use reputable antivirus tools (e.g., Norton, McAfee) to detect and block malicious links or attachments.
Two-Factor Authentication (2FA): Enable 2FA on accounts to add an extra layer of security, even if credentials are stolen.
Browser Security: Use browsers with built-in phishing protection (e.g., Chrome, Firefox) and keep them updated.
DNS Filtering: Use services like Cisco Umbrella to block access to known malicious domains.
4. Secure Your Devices and Accounts
Update Software: Regularly update your operating system, browsers, and apps to patch vulnerabilities.
Use Strong Passwords: Create unique, complex passwords and use a password manager (e.g., LastPass, 1Password).
Limit Public Wi-Fi: Avoid accessing sensitive accounts on unsecured Wi-Fi; use a VPN if necessary.
5. Educate Yourself and Others
Training: Take cybersecurity awareness courses to recognize phishing tactics (e.g., KnowBe4, SANS Institute).
Simulations: Organizations can run phishing simulations to train employees.
Stay Informed: Follow cybersecurity news (e.g., Krebs on Security, X posts from @CyberSec) for updates on new phishing trends.
6. Organizational Protections
Email Authentication: Implement DMARC, SPF, and DKIM to prevent email spoofing.
Employee Policies: Enforce strict policies for verifying financial requests or sensitive data sharing.
Incident Response: Establish a plan to report and mitigate phishing incidents quickly.
What to Do If You Fall Victim
[1] – Act Quickly: Change passwords for affected accounts and enable 2FA.
[2] – Report: Notify the organization being impersonated (e.g., your bank) and report the phishing attempt to authorities (e.g., FTC at ReportFraud.ftc.gov or IC3.gov).
[3] – Scan Devices: Run antivirus scans to detect and remove malware.
[4] – Monitor Accounts: Watch for unauthorized transactions or suspicious activity.
[5] – Notify IT: If at work, inform your IT/security team immediately.
Example How To Plan Protection in Action
Scenario: You receive an email from “admin@yourcompany.com” requesting a wire transfer.
Step 1: Verify the email address. Notice it’s actually “admin@yourcompanny.com” (note the extra “n”).
Step 2: Call your admin using a known phone number to confirm. They deny sending the email.
Step 3: Report the email to your IT team, who flags it as a BEC attempt and blocks the domain.
Step 4: Enable 2FA on your email account to prevent further unauthorized access.
Artificial Intelligence or AI significantly impacts daily life by automating tasks, personalizing experiences, and enhancing various aspects of our routines.
This includes voice assistants, personalized recommendations, smart home devices, and transportation systems, making life more efficient and convenient. AI also plays a role in healthcare, finance, and education, improving accuracy, personalization, and access to information.
Here’s a breakdown of how it affects different aspects of everyday life
[1] – Personal Life
[1.1] – Smart Assistants: Tools like Siri, Alexa, and Google Assistant use AI to understand and respond to voice commands—setting alarms, answering questions, controlling smart homes, etc.
[1.2] – Recommendations: AI powers Netflix, YouTube, and Spotify suggestions based on your behavior.
[1.3] – Photo Management: AI helps organize and enhance photos with facial recognition and automatic adjustments.
[2] – Mobile & Internet Usage
[2.1] – Search Engines: Google uses AI for predictive search, ranking results, and understanding natural language queries.
[2.2] – Social Media: AI curates your feed, detects spam, applies filters, and even identifies harmful content.
[2.3] – Spam Filters: Email platforms use AI to block junk or phishing messages.
[3] – Shopping & E-commerce
[3.1] – Product Recommendations: Platforms like Amazon and Flipkart use AI to show items you are likely to buy.
[3.2] – Chatbots: Provide 24/7 customer service and answer queries instantly.
[3.3] – Inventory Management: AI predicts demand and automates restocking behind the scenes.
[4] – Transportation
[4.1] – Navigation: Google Maps and Waze use AI to analyze traffic patterns and suggest the fastest routes.
[4.2] – Ride-sharing: Apps like Uber and Ola use AI to match drivers, set dynamic pricing, and optimize routes.
[4.3] – Autonomous Vehicles: Companies like Tesla and Waymo use AI for self-driving technology.
[5] – Finance & Banking
[5.1] – Fraud Detection: AI systems monitor transactions to detect and prevent fraud.
[5.2] – Loan Approvals: AI helps banks evaluate creditworthiness faster.
[5.3] – Personal Finance: Apps like Mint or CRED use AI to track spending and suggest saving tips.
[6] – Work & Productivity
[6.1] – Automation: AI automates repetitive tasks like data entry, scheduling, and reporting.
[6.2] – Recruitment: HR tools use AI to scan resumes and find the best candidates.
[6.3] – Writing & Creativity: Tools like ChatGPT and Grammarly help with writing, editing, and generating ideas.
[7] – Healthcare
[7.1] – Diagnostics: AI helps analyze medical scans (e.g., MRI, CT) and detect diseases early.
[7.2] – Virtual Health Assistants: Offer basic health advice and reminders.
[7.3] – Drug Discovery: Speeds up research by predicting how different compounds might work.
[8] – Home & Lifestyle
[8.1] – Smart Home Devices: Thermostats (e.g., Nest), security cameras, and lights adjust based on patterns and preferences.
[8.2] – Fitness Trackers: AI in devices like Fitbit or Apple Watch offers health insights and motivation.