
Data Flow Diagram Defines Graphical / Visualization Diagram of any Task / Business, It is represented as a set of symbols, notations to represent a Diagram.
DFD referred as Structured Systems Analysis and Design Method (SSADM).
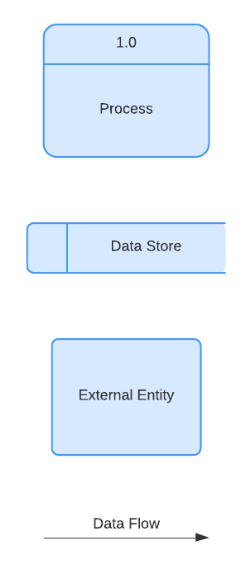
Data Flow Diagram Four Type Entity::
“It is a set of four main elements: entity, process, data store and data flow.”
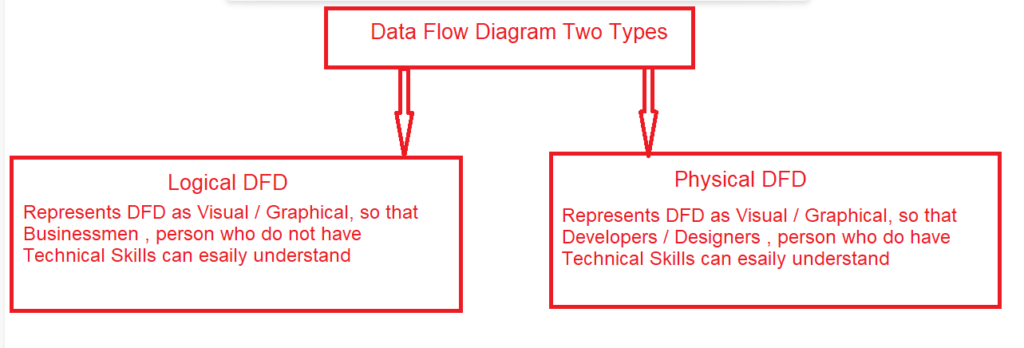
Data Flow Diagram Types :: There are two types Data Flow Diagram.
Data Flow Diagram Levels :: There are three levels Data Flow Diagram.
[ a ] – Level -0 :: Represents basic or context graphical diagram of Business Logic, It represents single line diagram
[ b ] – Level -1 :: Represents more detailed of basic or context graphical diagram of Business Logic, It represents multi line diagram
[ c ] – Level -2 :: Represents advanced graphical diagram of Business Logic, It represents detailed overview diagram, it is collection of more detailed symbols and notation.