In today’s Agile-driven organizations, clarity of roles is not just important — it’s essential for delivery, collaboration, and stakeholder alignment.
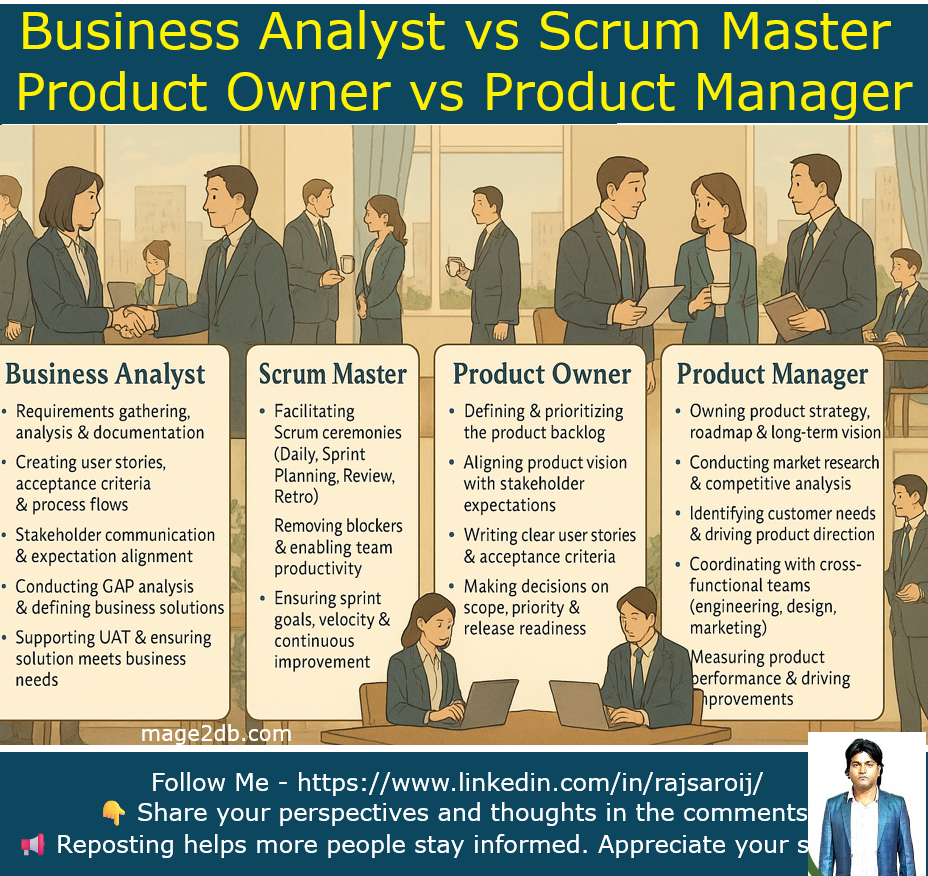
To make things simpler, I created a Ghibli-style professional banner highlighting the key roles & responsibilities of:
👤 Business Analyst: (Roles & Responsibilities )
- Requirements gathering, analysis & documentation
- Creating user stories, acceptance criteria & process flows
- Stakeholder communication & expectation alignment
- Conducting GAP analysis & defining business solutions
- Supporting UAT & ensuring solution meets business needs
👤 Scrum Master: (Roles & Responsibilities )
- Facilitating Scrum ceremonies (Daily, Sprint Planning, Review, Retro)
- Removing blockers & enabling team productivity
- Coaching the team on Agile/Scrum practices
- Ensuring sprint goals, velocity & continuous improvement
- Protecting the team from scope creep & distractions
👤 Product Owner: (Roles & Responsibilities )
- Defining & prioritizing the product backlog
- Aligning product vision with stakeholder expectations
- Writing clear user stories & acceptance criteria
- Making decisions on scope, priority & release readiness
- Ensuring maximum value delivery each sprint
👤 Product Manager: (Roles & Responsibilities )
- Owning product strategy, roadmap & long-term vision
- Conducting market research & competitive analysis
- Identifying customer needs & driving product direction
- Coordinating with cross-functional teams (engineering, design, marketing)
- Measuring product performance & driving improvements
Each role plays a unique part in ensuring successful product delivery:
🔹 BA → Translates business needs into clear requirements
🔹 SM → Empowers the Agile team and removes blockers
🔹 PO → Owns the product backlog + sprint value
🔹 PM → Defines long-term product vision & strategy
When these roles work together smoothly, teams deliver faster, better, and with more value.