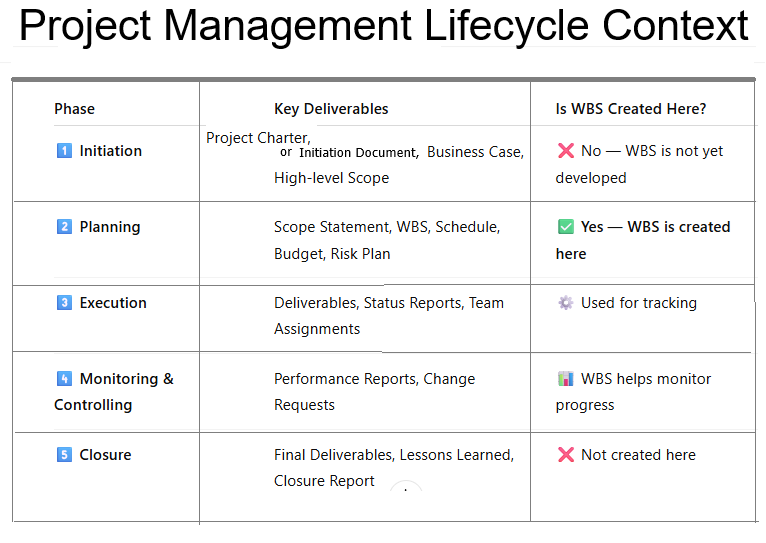
How Data Warehouse Support ETL (Extract, Transform, and Load)

Extract, transform, and load (ETL) is the process of combining data from multiple sources into a large, central repository called a data warehouse. ETL uses a set of business rules to clean and organize raw data and prepare it for storage, Business Intelligence, Data Analytics, and Machine Learning (ML).

Collect raw data from various sources (databases, APIs, flat files, etc.).

Step [1]- Extract Data: ETL process is used to extract data from various sources such as transactional systems, spreadsheets, and flat files. This step involves reading data from the source systems and storing it in a staging area.

Clean, filter, and format raw data to match the data warehouse schema.

Step [2] – Transform Data: The extracted data is transformed into a format that is suitable for loading into the data warehouse. This may involve cleaning and validating the data, converting data types, combining data from multiple sources, and creating new data fields.

Store transformed data into the data warehouse for reporting and analysis.

Step [3] – Load Data: Once Data transformed, it is loaded into the data warehouse. This step included creating the physical data structures and loading the data into the warehouse.

ETL Working Flow in Data Warehouse

Differentiate among Data Swap, Data Puddles, Data warehouse & Data Lake with Examples.

1. Data Swap (Data Mart)

A Temporary storage location where data is exchanged or transferred between two systems, It typically handles small transactional data in a structured format.

  • Definition: A small, focused subset of a data warehouse designed for a specific department or team.
  • Scope: Limited to a single business unit (e.g., Sales, Marketing).
  • Purpose: Quick access to relevant data for specific needs.
  • Structure: Highly structured and pre-processed.
  • Example:
    • A sales data mart containing monthly sales, customer data, and product performance for the sales department.
    • I a E-commerce, when a customer makes a payment , the payment gateway system exchanges transaction details with the Order Mgt System.

2. Data Puddles

Small, isolated collections or data typically focused on a specific department or project. These are often uncoordinated & may no follow a consistent schema.

  • Definition: A small-scale, isolated data repository created by individual teams for short-term use.
  • Scope: Project or Department specific or team-specific with minimal governance.
  • Purpose: Temporary storage for ad-hoc analysis or experiments.
  • Structure: Semi-structured or unstructured, often created for quick insights.
  • Example:
    • A marketing team’s Excel sheets and Google Drive files collecting social media metrics for a campaign.
    • It serves marketing specific needs but is not accessible across other departments.

3. Data Warehouse

A centralized repository of structured data that is cleaned, organized & optimized for querying & reporting.
Data Warehouses support Business Intelligence(BI) & analytics by integrating data from multiple sources.

  • Definition: A centralized, structured repository that stores processed and organized data from multiple sources.
  • Scope: Enterprise-wide, integrating data from across the organization.
  • Purpose: Supports business intelligence (BI), reporting, and analysis.
  • Structure: Highly structured with defined schemas (star/snowflake schemas).
  • Example:
    • Amazon Redshift or Google BigQuery storing customer transactions, inventory, and supply chain data for reporting and forecasting.
    • An otg

4. Data Lake

A scalable repository that stores vast amounts of data as

Structured Data Format, Unstructured Data Format, Semi Structured Data Format.

It is used for advanced analytics, machine learning & big data

  • Definition: A vast, unstructured repository that stores raw data from various sources in its native format.
  • Scope: Enterprise-wide with the ability to store massive datasets.
  • Purpose: Enables advanced analytics, machine learning (ML), and data discovery.
  • Structure: Unstructured or semi-structured; no predefined schema.
  • Example:
    • AWS S3 or Azure Data Lake storing IoT sensor data, social media feeds, and raw logs for future analysis.
    • An organization uses data warehouse (Snowflake or Amazon redshift) to coordinate sales, customer & financial data, It allows analysts to create dashboards & generate reports for long term business strategy.

Key Differences

AspectData Swap (Mart)Data PuddleData WarehouseData Lake
ScopeDepartment-specificProject or team-specificOrganization-wideOrganization-wide
Data StructureStructuredSemi-structured/unstructuredStructuredUnstructured/semi-structured
Data VolumeSmall to mediumSmallLargeVery large
PurposeSpecific business unit reportingTemporary/quick analysisReporting & BIAdvanced analytics & big data
Storage FormatPre-processedRawPre-processedRaw
ProcessingMinimalMinimalExtensive ETLELT (Extract, Load, Transform later)
ExampleSales Mart for KPIsExcel files for project insightsEnterprise-wide BI reportsIoT sensor and video data repository

Explain Activity Diagram, Network Diagram, Forward Pass, and Backward Pass

Step-1: Activity Diagram:

  • A flowchart that visually represents the sequence of activities and decisions in a process or project. It shows the flow from one activity to another but lacks time or resource detail.
  • Used primarily in UML (Unified Modeling Language) for software modeling.

Step-2: Network Diagram:

  • A graphical representation of a project’s activities and their dependencies. It shows the order and sequence of tasks using nodes (activities) and arrows (dependencies).
  • Two types:
    • AOA (Activity on Arrow) – Arrows represent activities.
    • AON (Activity on Node) – Nodes represent activities (most common).

Step-3: Forward Pass:

  • Calculates the earliest start (ES) and earliest finish (EF) times for each activity, beginning at the project start.
  • Formula:

Step-4: Backward Pass:

  • Determines the latest start (LS) and latest finish (LF) times by moving backward from the project’s end.
  • Formula:

Differences Between Activity Diagrams, Network Diagrams, and Gantt Charts

AspectActivity DiagramNetwork DiagramGantt Chart
PurposeModels workflows/processesMaps activity dependenciesTracks task schedules over time
VisualizationFlowchart of activitiesNodes (tasks) and arrows (dependencies)Bars showing task duration and overlap
Time RepresentationNo time elementShows project timeline and dependenciesDirectly shows duration, progress, and deadlines
FocusWorkflow, software modelingCritical path and task dependenciesSchedule tracking and resource allocation
Use CaseSoftware and system modelingProject planning and schedulingProject management and tracking progress

Step-5: Calculating the Critical Path

  • Critical Path:
    • The longest path through the network diagram. It shows the sequence of tasks that determine the shortest project duration. Any delay in the critical path delays the project.

Steps to Calculate Critical Path:

  1. List all project activities and durations.
  2. Identify dependencies (predecessors).
  3. Draw the network diagram.
  4. Perform forward and backward passes.
  5. Calculate slack for each activity.
  6. The path with zero slack is the critical path.

Step-6: Calculating Slack (Float)

  • Slack:
    • The amount of time an activity can be delayed without delaying the project.
    • Formula:
    • Zero Slack indicates the activity is on the critical path.

How To Create Pivot Table & Pivot Chart

The following things need to be followed

Step [1] – Before Pivot Table Ensure Your Data Correct Format

Ensure your data is structured correctly.

  • Format: Use a table or list format with clear headers in the first row.
  • No Blank Rows/Columns: Ensure there are no empty rows or columns within the dataset.
  • Consistent Data: Data should be consistent (e.g., dates in one column, numbers in another).

Step [2] –

[2.1]Select the Data: Highlight the entire dataset (including headers).

[2.2] – Go to “Insert” Tab: Click on the “Insert” tab in Excel.

[2.3] – Choose Pivot Table:

  • Click on “Pivot Table” in the Tables group.

[2.4]- Select Pivot Table Location:

  • New Worksheet: Places the Pivot Table in a new sheet. or
  • Existing Worksheet: Allows you to specify the location.

Note:: For best result always try to select New Worksheet

[2.5] – Click “OK.”

Step [3] – Build the Pivot Table

Filters (Optional): Add a field to the Filters area to filter data dynamically.

A blank Pivot Table field list appears.

Drag and Drop Fields:

Rows: Drag a categorical field (e.g., Physical store, Country Name) into the “Rows” area.

Values: Drag a numerical field (e.g., List Price, Actual Price) into the “Values” area.

Columns (Optional): Drag another field (e.g., Date) to see data across columns.

Step [4] – Physical Store in Rows & List Price in Values, by default List Price display sum of list price corresponding to physical store.

[4.1] – Grand Total = Sum of all Physical Store List Price

[4.2] – Right Click any of (rows) Numeric value of (Sum of List Price)–>display

  • Sort
  • Summarize Values By
  • Show Values At

[4.3] – Summarize Values By

[a] – If Select Summarize Values By –> Count , result as

[b] – If Select Summarize Values By –> Average , result as

Once Select — Summarize Values By –> Average

[c] – If Select Summarize Values By –> Max , result as

Once Select — Summarize Values By –> Max

[d] – If Select Summarize Values By –> Min , result as

Once Select — Summarize Values By –> Min

[4.4] – Show Values As

–Once Select — Show Values As –> % of Grand Total

[4.5] – Sort->Smallest To Largest or Sort->Largest To Smallest

[a] Sort->Smallest To Largest result

[b] Sort->Largest To Smallest result

What are Herzberg Two-Factor Theory or Motivation-Hygiene Theory

Herzberg’s Two-Factor Theory:: It is also known as Motivation-Hygiene Theory::

Herzberg’s Two-Factor Theory or Motivation-Hygiene Theory is a foundational concept in understanding how to manage and motivate teams effectively. It focuses on two types of factors that influence job satisfaction and performance: motivators and hygiene factors.

Core Concepts of Herzberg’s Theory

1. Hygiene Factors (Extrinsic Factors)

  • These are basic workplace conditions and factors that prevent dissatisfaction but do not necessarily motivate employees to perform better.
  • Examples:
    • Salary and benefits
    • Job security
    • Work environment
    • Company policies
    • Relationships with colleagues and supervisors
  • If these factors are absent or inadequate, they lead to dissatisfaction. However, improving these factors alone won’t significantly increase motivation or satisfaction.

2. Motivators (Intrinsic Factors)

  • These factors are related to the nature of the work itself and are key to driving satisfaction and motivation.
  • Examples:
    • Achievement
    • Recognition
    • Responsibility
    • Personal growth and development
    • Meaningful work
  • The presence of motivators enhances satisfaction and inspires higher levels of performance.

Application of Herzberg’s Theory in Managing Teams

  1. Ensure Hygiene Factors Are in Place
    • Address and resolve complaints about work conditions, such as poor pay, unsafe environments, or outdated policies.
    • Maintain open communication channels to identify and mitigate dissatisfaction early.
  2. Focus on Motivators for Engagement
    • Empower team members by giving them autonomy and responsibilities that align with their strengths and career goals.
    • Provide opportunities for growth through training, upskilling, and challenging projects.
    • Recognize and celebrate achievements to boost morale and motivate individuals.
  3. Tailor Management Strategies
    • Understand individual team members’ motivators. For example, one person might value public recognition, while another may prioritize professional development.
    • Align tasks and responsibilities with what employees find meaningful and fulfilling.
  4. Create a Balance
    • While hygiene factors are essential to create a foundation of satisfaction, motivators are what drive sustained performance and engagement.
    • Combine practical improvements (e.g., competitive salaries and benefits) with intrinsic rewards (e.g., opportunities for innovation).
  5. Encourage Feedback and Adaptation
    • Regularly seek input from the team about what works and what doesn’t. This helps refine both hygiene and motivator strategies to meet the team’s evolving needs.

Practical Example

Imagine a project team working under tight deadlines:

  • Hygiene focus: Ensure the team has access to necessary resources, a comfortable work environment, and clear communication about goals.
  • Motivator focus: Recognize milestones achieved during the project, offer opportunities for leadership within the team, and highlight how their work contributes to the organization’s success.

By integrating Herzberg’s theory into team management, leaders can reduce dissatisfaction while fostering a motivated and high-performing team.

Prototype Model Features, Pros, Cons in Software Engineering, when should use

The Prototype Model is a project management and software development approach that involves creating early working versions of a product—called prototypes—to explore ideas, gather feedback, and refine the final product. It is especially useful in projects where requirements are not fully understood or are likely to evolve.

Key Features of the Prototype Model

  1. Early Visualization: Prototypes provide a tangible representation of the product early in the development process, helping stakeholders visualize the end result.
  2. Iterative Development: The model involves multiple iterations of designing, developing, and refining the prototype based on feedback.
  3. Customer Involvement: Stakeholders and end-users are actively involved in reviewing the prototype and providing feedback.
  4. Flexibility: Changes can be made easily in response to user feedback before the final product is built.

Phases of the Prototype Model

  1. Requirement Gathering and Analysis:
    • Initial requirements are collected from stakeholders.
    • Requirements are not expected to be fully detailed or complete at this stage.
  2. Quick Design:
    • A basic design or mockup is created focusing on the key aspects of the product.
    • This is not a detailed design but rather a framework for the prototype.
  3. Prototype Development:
    • A working version of the product (prototype) is developed.
    • It may include limited functionality and features.
  4. User Evaluation:
    • Stakeholders and end-users review the prototype.
    • Feedback is collected to understand what changes or improvements are needed.
  5. Refinement:
    • The prototype is modified based on the feedback.
    • This cycle of evaluation and refinement continues until stakeholders approve the design.
  6. Final Product Development:
    • Once the prototype meets all expectations, the final product is developed with the full functionality and features.

Pros of the Prototype Model

  1. Improved Communication: Helps stakeholders and developers clarify requirements through visual representation.
  2. Reduced Risk: Early feedback minimizes the risk of developing a product that does not meet user expectations.
  3. Enhanced User Satisfaction: Involvement of end-users ensures that the final product aligns with their needs.
  4. Flexibility in Design: Changes are easier and less costly to implement during the prototyping stage.

Cons of the Prototype Model

  1. Scope Creep: Users may keep requesting changes, leading to an expanding project scope.
  2. Time-Consuming: Iterative refinements can prolong the development timeline.
  3. Incomplete Analysis: Over-reliance on the prototype might lead to neglecting comprehensive requirement analysis.
  4. High Cost for Complex Prototypes: Developing detailed prototypes can be expensive.

When to Use the Prototype Model

  1. Unclear Requirements: Ideal for projects where requirements are not well-defined or are expected to change.
  2. User-Centric Products: Useful for projects requiring significant user interaction, such as user interfaces and mobile apps.
  3. High-Risk Projects: Suitable for projects where early validation of concepts can reduce risks.

What are Activity and Task in Project Management

Activities and Tasks are foundational components used to define, plan, and execute a project. While they are closely related, they differ in scope and detail.

Activities

  • Definition: High-level components or stages of a project that group related tasks together. They often represent broader actions or processes.
  • Purpose: To organize and manage the workflow of a project by breaking it into manageable sections.
  • Characteristics:
    • Encompasses multiple related tasks.
    • Describes what needs to be achieved.
    • Focuses on broader goals or phases (e.g., “Develop the app interface,” “Conduct testing”).
    • Often used in creating schedules or timelines, such as in Gantt charts.

Example:

  • Activity: “Plan the Project”
    • Includes tasks like defining objectives, identifying stakeholders, and preparing a project charter.

Tasks

  • Definition: The specific, detailed actions or steps needed to complete an activity.
  • Purpose: To provide a granular view of the work, allowing for assignment, tracking, and measurement.
  • Characteristics:
    • Smaller, focused units of work.
    • Describes how to achieve the activity.
    • Clearly defined in terms of deliverables, timelines, and responsibility.
    • Often assigned to specific individuals or teams.

Example:

  • Activity: “Develop the app interface”
    • Task 1: Create wireframes.
    • Task 2: Design user interface mockups.
    • Task 3: Get feedback on designs.

Work Breakdown Structure (WBS) in Project Management

Work Breakdown Structure (WBS)

Definition:
A Work Breakdown Structure (WBS) is a hierarchical decomposition of a project into smaller, manageable components. It breaks down the project scope into deliverables and tasks, making it easier to plan, execute, monitor, and control the project. Each level of the WBS provides increasing detail about the work required to achieve the project objectives.


Purpose of the WBS

  1. Scope Clarity: Clearly defines the project scope by outlining all deliverables and tasks.
  2. Manageability: Divides the project into manageable sections, making it easier to assign responsibilities and track progress.
  3. Baseline for Planning: Provides a framework for scheduling, budgeting, resource allocation, and risk management.
  4. Communication Tool: Enhances communication by presenting the project structure visually.

Structure of a WBS

The WBS is typically visualized in a tree-like diagram or outline format with multiple levels:

  1. Level 1: The Project Name or overall deliverable (e.g., “New Office Construction”).
  2. Level 2: Major deliverables or phases of the project (e.g., “Design,” “Construction,” “Move-In”).
  3. Level 3 and Beyond: Breaks down deliverables into smaller, detailed tasks (e.g., “Order Furniture,” “Install Wiring,” etc.).

Key Characteristics of a WBS

  1. Deliverable-Oriented: Focuses on outcomes rather than activities.
  2. 100% Rule: All work required for the project must be included in the WBS, ensuring nothing is missed.
  3. Mutually Exclusive: Each WBS element should be distinct to avoid overlap or redundancy.
  4. Hierarchical: The structure progresses from high-level deliverables to more detailed tasks.

Steps to Create a WBS

  1. Define the Project Scope: Understand the goals, deliverables, and requirements of the project.
  2. Identify Major Deliverables: Break the project into high-level components or phases.
  3. Decompose Deliverables: Divide each deliverable into smaller, more detailed components until manageable tasks are identified.
  4. Assign Unique Codes: Assign identifiers to each WBS element for tracking (e.g., 1.1, 1.2.1).
  5. Validate the WBS: Ensure all project work is accounted for and follows the 100% Rule.

Formats of WBS

  1. Tree Diagram: Visual hierarchical structure.
  2. Outline/Tabular Format: Indented list showing the hierarchy.
  3. Mind Map: Creative and visual representation of deliverables.

Example of a WBS

Project Name: Office Relocation

Level 1: ProjectLevel 2: Major DeliverablesLevel 3: Subtasks
Office Relocation1. Design1.1 Finalize Floor Plan
1.2 Obtain Necessary Approvals
2. Construction2.1 Demolish Existing Partitions
2.2 Install Wiring and Networking
3. Move-In3.1 Pack Existing Office Materials
3.2 Transport and Set Up Equipment

Benefits of WBS

  1. Improved Planning: Provides a clear roadmap for project execution.
  2. Better Resource Allocation: Helps allocate resources effectively by breaking down tasks.
  3. Enhanced Monitoring: Enables tracking of progress and performance against deliverables.
  4. Reduced Risks: Identifies potential risks by detailing all work elements.

WBS vs. Project Schedule

  • WBS focuses on breaking down deliverables into tasks.
  • Project Schedule focuses on the timing and sequencing of tasks.

Conclusion

The Work Breakdown Structure (WBS) is a foundational tool in project management. It ensures clarity, structure, and organization, allowing project teams to manage scope effectively and deliver results on time and within budget.

Difference Between Nominal Group Technique (NGT) and Delphi Group Technique

Nominal Group Technique (NGT) and Delphi Technique are structured group decision-making methods used to gather information and prioritize ideas.

Definition Nominal Group Technique (NGT)

The Nominal Group Technique (NGT) is a structured group decision-making process used to generate and prioritize ideas. It emphasizes equal participation, ensuring that all members contribute without the influence of dominant personalities.

Definition Delphi Group Technique

Delphi Technique is a structured decision-making and forecasting process that gathers input from a panel of experts anonymously. It uses multiple rounds of questionnaires to refine ideas and achieve a consensus without direct interaction among participants.

NGT is ideal for in-person, small group interactions with immediate results.

Delphi is suited for expert-driven, remote, and anonymous input that requires more time to achieve consensus.

Collect Requirements Process in Project Management, Tools, Techniques, RTM

Collect Requirements Process in Project Management

The Collect Requirements Process is a critical step in the Project Scope Management knowledge area. It involves determining, documenting, and managing stakeholder needs and requirements to meet project objectives. This process ensures that the project deliverables align with stakeholder expectations and business goals.


Definition

The Collect Requirements Process is the systematic identification and documentation of:

  • What the project must deliver (functional and non-functional requirements).
  • Who the stakeholders are and their expectations.
  • Why the requirements are necessary to achieve project objectives.

Purpose of Collect Requirements

  1. Define Scope: Establishes a clear understanding of what is included in the project.
  2. Align Expectations: Ensures that all stakeholders’ needs are captured and agreed upon.
  3. Set the Foundation: Provides the baseline for creating the Work Breakdown Structure (WBS) and planning project activities.
  4. Minimize Risks: Reduces the risk of missed requirements or scope creep.

Inputs of the Collect Requirements Process

  1. Project Charter: High-level project goals, constraints, and deliverables.
  2. Project Management Plan: Relevant components like the Scope Management Plan, Requirements Management Plan, and Stakeholder Engagement Plan.
  3. Project Documents:
    • Stakeholder Register: Identifies stakeholders and their influence or interest in the project.
    • Assumptions Log: Lists assumptions that may influence requirements.
  4. Business Documents:
    • Business Case: Justifies the project and its alignment with organizational goals.
  5. Enterprise Environmental Factors (EEFs): Includes market conditions, regulations, and organizational culture.
  6. Organizational Process Assets (OPAs): Includes templates, lessons learned, and existing requirement standards.

Tools and Techniques

  1. Interviews: One-on-one discussions with stakeholders to elicit detailed requirements.
    • Example: Interviewing department heads to understand system needs.
  2. Focus Groups: Engaging a group of stakeholders to discuss and refine requirements.
    • Example: A workshop with end users to explore user interface preferences.
  3. Workshops: Collaborative sessions with stakeholders to gather and document requirements.
    • Example: A brainstorming session with cross-functional teams.
  4. Surveys and Questionnaires: Collecting structured responses from a large group of stakeholders.
    • Example: Sending a survey to customers to gather feature preferences.
  5. Observations: Watching how end users interact with current systems to identify improvements.
    • Example: Observing how employees process orders in an inventory system.
  6. Prototypes: Developing a preliminary version of the product to gather feedback.
    • Example: Creating a mockup of a mobile app for user feedback.
  7. Group Decision-Making Techniques: Consensus-building among stakeholders.
    • Techniques: Voting, prioritization, or Delphi technique.
  8. Document Analysis: Reviewing existing documentation for relevant requirements.
    • Example: Analyzing past project reports or regulatory guidelines.
  9. Mind Mapping and Affinity Diagrams: Organizing ideas and identifying relationships between requirements.
  10. Requirements Traceability Matrix (RTM): Linking requirements to their sources and project deliverables.

Outputs of the Collect Requirements Process

  1. Requirements Documentation:
    • A detailed description of all project requirements, categorized as:
      • Functional Requirements: Specific functionalities or features.
        • Example: “The website must support online payments.”
      • Non-Functional Requirements: Performance, security, or usability standards.
        • Example: “The system must handle 1,000 concurrent users.”
      • Business Requirements: High-level business goals.
        • Example: “Increase sales by 15% within 6 months.”
      • Technical Requirements: Hardware, software, or system-related needs.
        • Example: “The system must be compatible with Windows 11.”
  2. Requirements Traceability Matrix (RTM):
    • A table that links requirements to their sources, project deliverables, and test cases.

Benefits of the Collect Requirements Process

  1. Clarity: Reduces misunderstandings by documenting detailed stakeholder needs.
  2. Alignment: Aligns project objectives with organizational goals and stakeholder expectations.
  3. Risk Mitigation: Identifies gaps or conflicts in requirements early, preventing costly changes later.
  4. Improved Communication: Fosters collaboration and transparency among stakeholders.

Challenges in Collecting Requirements

  1. Conflicting Stakeholder Interests: Balancing differing priorities.
  2. Incomplete Information: Stakeholders may not fully articulate their needs.
  3. Scope Creep: Uncontrolled changes to requirements.
  4. Communication Barriers: Language or technical jargon can cause misunderstandings.