
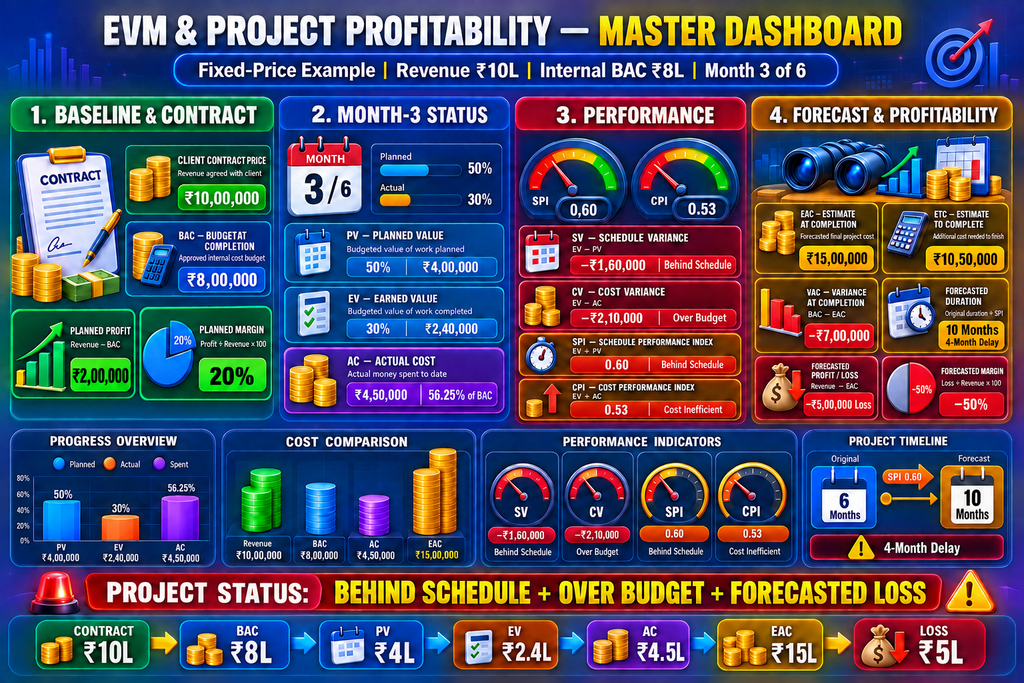
Fixed‑Price Project Profitability and EVM Analysis
₹10 Contract Price vs ₹8 Lakh Cost Budget
“Contract Price or Client Billing Value, Project Revenue or Commercial Value – “-The amount the client agrees to pay under the signed contract.
“Budget at Completion (BAC) or Approved Project Cost Budget or Internal Delivery Budget or Cost Baseline – “The internal cost ceiling approved for delivering the project.
Table of Contents
- 1. Project Scenario
- 2. Contract Revenue and Cost Budget
- 3. Budget at Completion (BAC)
- 4. Monthly Planned Checkpoints
- 5. Month‑3 Performance Position
- 6. Planned Value (PV)
- 7. Earned Value (EV)
- 8. Actual Cost (AC)
- 9. EVM Summary at Month‑3
- 10. Schedule Variance (SV)
- 11. Schedule Performance Index (SPI)
- 12. Cost Variance (CV)
- 13. Cost Performance Index (CPI)
- 14. Complete Month‑3 Health Check
- 15. Forecasted Final Cost (EAC)
- 16. Estimate to Complete (ETC)
- 17. Variance at Completion (VAC)
- 18. Forecasted Project Duration
- 19. Planned Profitability
- 20. Forecasted Profit or Loss
- 21. Forecasted Profit Margin
- 22. Planned vs Forecasted Commercial Position
- 23. Why a Profitable Project Can Become Loss‑Making
- 24. Monthly Management Checkpoints
- 25. Recommended Recovery Plan
- 26. Client Report vs Internal Report
- 27. Common Calculation Mistakes
- 28. Final Project Summary
- 29. Final Conclusion
1 – Project Scenario
Fixed-price software project with ₹10 lakh revenue, ₹8 lakh cost budget, planned profit ₹2 lakh, and 6-month duration.
A software company signs a fixed-price project worth ₹10,00,000 with a planned duration of six months. The company approves an internal delivery-cost budget (BAC) of ₹8,00,000, expecting to earn a ₹2,00,000 profit with a 20% margin. At the end of Month 3, the project should be 50% complete, but only 30% has been completed. Meanwhile, the company has already spent ₹4,50,000—equivalent to 56.25% of its internal cost budget.
2 – Contract Price and Cost Budget
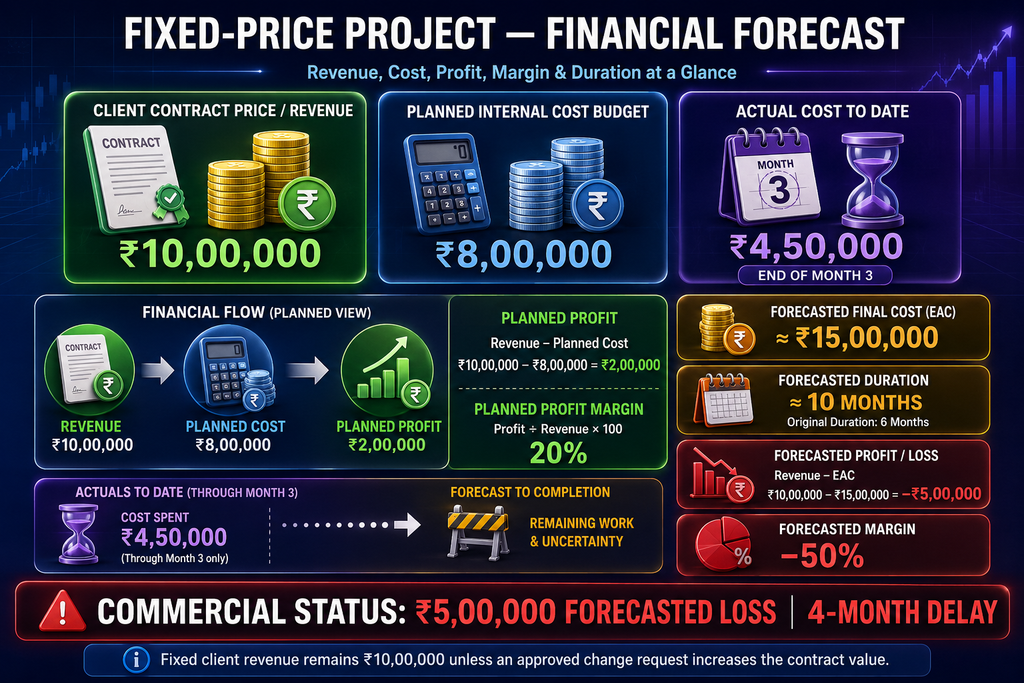
Contract Price is the amount paid by the client, while the cost budget is the amount the company plans to spend delivering the project.
Contract Price: ₹10,00,000
BAC: ₹8,00,000
Planned profit: ₹2,00,000 (20% margin).
3 – Budget at Completion (BAC)
BAC is the total approved internal cost budget for completing 100% of the project.
BAC=₹8,00,000 Summary: The company expects to deliver the entire project while spending no more than ₹8 lakh.
BAC is the approved internal cost baseline (₹8 lakh). It is not revenue or profit.
4 – Monthly Planned Checkpoints
Monthly checkpoints compare planned cumulative progress with actual project progress and expenditure.
Progress evenly distributed across 6 months: 16.7%, 33.3%, 50%, 66.7%, 83.3%, 100%.
5 – Month‑3 Performance Position
The Month-3 performance position is a formal comparison of the approved baseline with actual project results at the end of Month 3.
Planned 50% vs actual 30%. Actual cost ₹4.5 lakh. Behind schedule and over budget.
6 – Planned Value (PV)
Planned Value (PV) is the budgeted value of work that should have been completed by the status date.
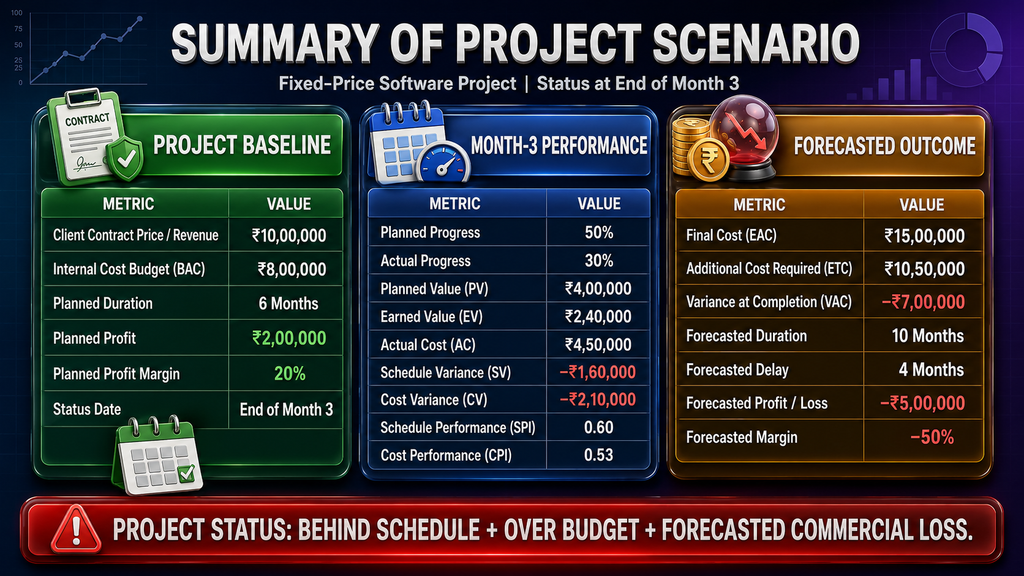
PV = BAC × Planned Progress = ₹4,00,000.
7 – Earned Value (EV)
Earned Value (EV is the budgeted value of the work actually completed by the status date.
EV = BAC × Actual Progress = ₹2,40,000.
8 – Actual Cost (AC)
Actual Cost (AC is the real cost incurred for project work up to the status date.
AC = ₹4,50,000 (56.25% of BAC consumed).
9 – EVM Summary at Month‑3
An EVM summary combines BAC, PV, EV and AC to establish the project’s current performance position.
BAC: ₹8,00,000 | PV: ₹4,00,000 | EV: ₹2,40,000 | AC: ₹4,50,000.
10 – Schedule Variance (SV)
Schedule Variance (SV) measures whether the project is ahead of or behind its approved schedule.
SV = EV − PV = −₹1,60,000 (behind schedule).
11 – Schedule Performance Index (SPI)
SPI (Schedule Performance Index ) measures how efficiently the project is progressing against the approved schedule.
SPI = EV ÷ PV = 0.60 (poor schedule efficiency).
12 – Cost Variance (CV)
Cost Variance (CV) compares the budgeted value of completed work with the actual amount spent.
CV = EV − AC = −₹2,10,000 (over budget).
13 – Cost Performance Index (CPI)
Cost Performance Index (CPI) measures the project’s cost efficiency.
CPI = EV ÷ AC ≈ 0.53 (poor cost efficiency).
14 – Complete Month‑3 Health Check
The health check combines schedule, cost and physical progress into one project-status assessment.
30% complete vs 50% planned. 56.25% budget consumed. SPI 0.60, CPI 0.53.
15 – Forecasted Final Cost -Estimate at Completion (EAC)
Estimate at Completion (EAC) forecasts the project’s total final cost.
EAC = BAC ÷ CPI ≈ ₹15,00,000.
Summary: The project originally expected to cost ₹8 lakh but is now forecasted to cost approximately ₹15 lakh.
16 – Estimate to Complete (ETC)
ETC is the estimated additional cost (rest remaining project cost to be completed project) required from the status date until project completion.
ETC = EAC − AC = ₹10,50,000.
Summary: After already spending ₹4.5 lakh, the company may need another ₹10.5 lakh to complete the project.
17 – Variance at Completion (VAC)
VAC measures the forecasted difference between the approved internal budget and final project cost.
VAC = BAC − EAC = −₹7,00,000 (overrun).
Summary: The project is forecasted to exceed its ₹8 lakh internal budget by ₹7 lakh.
18 – Forecasted Project Duration
Forecasted duration estimates the total project timeline if current schedule efficiency continues.
Forecasted duration = 10 months (4-month delay).
p>Summary: The project may require approximately 10 months instead of six months, producing a four-month delay.19 – Planned Profitability
Planned profitability is the expected financial return before project execution begins.
At initiation: Revenue ₹10,00,000, Cost budget ₹8,00,000, Profit ₹2,00,000, Margin 20%.
Summary: The project originally expected to generate a ₹2 lakh profit.
20 – Forecasted Profit or Loss
Planned margin represents planned profit as a percentage of contract price.
Forecasted cost ₹15,00,000. Revenue unchanged at ₹10,00,000. Forecasted loss = −₹5,00,000.
Summary: The company originally expected to retain 20% of project revenue as profit.
21 – Forecasted Profit Margin
Forecasted profit or loss compares the fixed client revenue with the project’s forecasted final cost.
Forecasted margin = −50%. Planned margin 20% → deterioration of 70 percentage points.
Summary: The originally profitable project is now forecasting a ₹5 lakh loss.
22 – Planned vs Forecasted Commercial Position
Forecasted margin measures the expected final profit or loss as a percentage of revenue.
Planned: Profit ₹2,00,000, Margin 20%, Duration 6 months.
Forecasted: Loss ₹5,00,000, Margin −50%, Duration 10 months.
Summary: The forecasted loss is equal to 50% of the project’s contract revenue.
23 – Why a Profitable Project Can Become Loss‑Making
Causes include underestimated effort, scope creep, rework, poor requirements, vendor delays, low productivity, and weak change control.
24 – Monthly Management Checkpoints
Track delivery performance, cost performance (BAC, PV, EV, AC, SV, CV, SPI, CPI, EAC, ETC, VAC), commercial metrics, quality, risks, and recovery actions.
25 – Recommended Recovery Plan
Steps: Validate progress, root‑cause analysis, re‑estimate remaining work, control scope, protect critical activities, reduce rework, review commercial options, reforecast regularly.
26 – Client Report vs Internal Report
Client report: RAG status, milestones, risks, change requests, forecasted delivery.
Internal report: Resource costs, CPI, EAC, VAC, profit/loss, margin deterioration, commercial exposure.
27 – Common Calculation Mistakes
Examples: Using revenue as BAC, miscalculating percentages, using revenue for EV, mixing budget overrun with commercial loss, using rounded CPI for forecasts.
28 – Final Project Summary
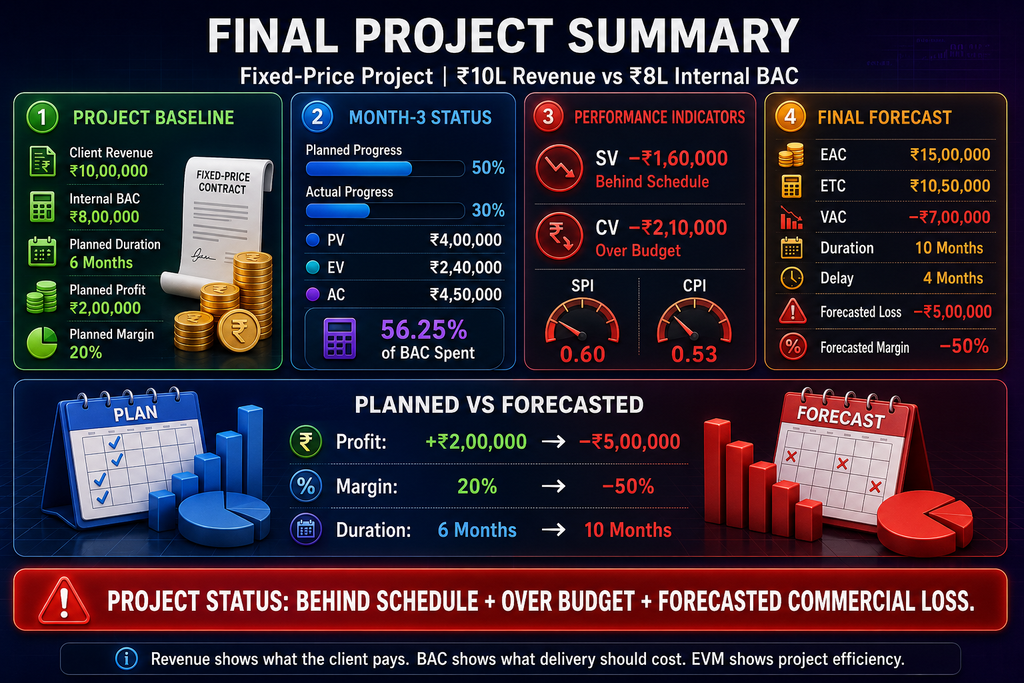
At Month 3: 30% complete vs 50% planned, 56.25% budget consumed, SPI 0.60, CPI 0.53, EAC ₹15,00,000, forecasted loss ₹5,00,000, margin −50%, duration 10 months.
29 – Final Conclusion
The project was planned for ₹2 lakh profit at 20% margin but is now forecasted to deliver a ₹5 lakh loss at −50% margin. Lesson: Revenue shows client payment, BAC shows delivery cost, EVM shows efficiency, profitability shows commercial sense.