Skip reading 100s of pages docs or watching hours of video. Extract the insights (more summarized) you need, fast
Access all premium AI models
Chat with Llama 4, DeepSeek R1, GPT-4o, Claude, Gemini 2.5 Pro and more!
Chat with your documents
Instant Youtube summaries
Document comparison
AI text editor and more!
Still doing research the hard way?
❌ Manually reading endless reports? ❌ Watching long videos just for key insights? ❌ Struggling with writing, citations, and structuring?
It’s time to upgrade your workflow.
With Otio, that’s exactly what you get!
No more wasting hours reading, summarizing, and organizing information—Otio does it for you instantly.
What Makes Otio Stand Out? ✅ Lightning-Fast Summaries – Extract key takeaways from long-form content instantly. ✅ AI-Assisted Writing – Say goodbye to writer’s block with structured drafts and edits. ✅ Reliable Research – Get accurate, cited information without endless fact-checking. ✅ Automated Workflows – Set up smart AI routines to streamline your research process.
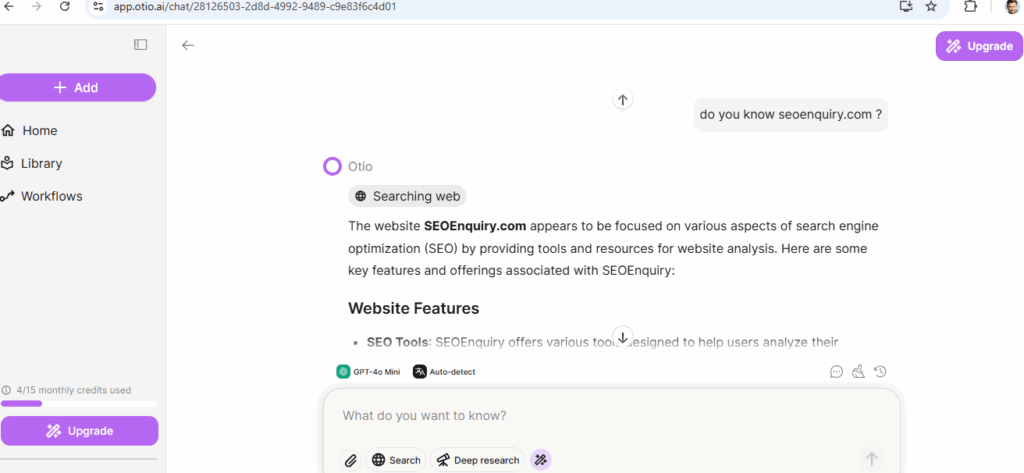
By using otio.ai your asking query will be detailed, structured AI summaries & Automatically generated summaries from Images, Videos, PPT, Audio, Docs, Links, PDFs to Youtube videos
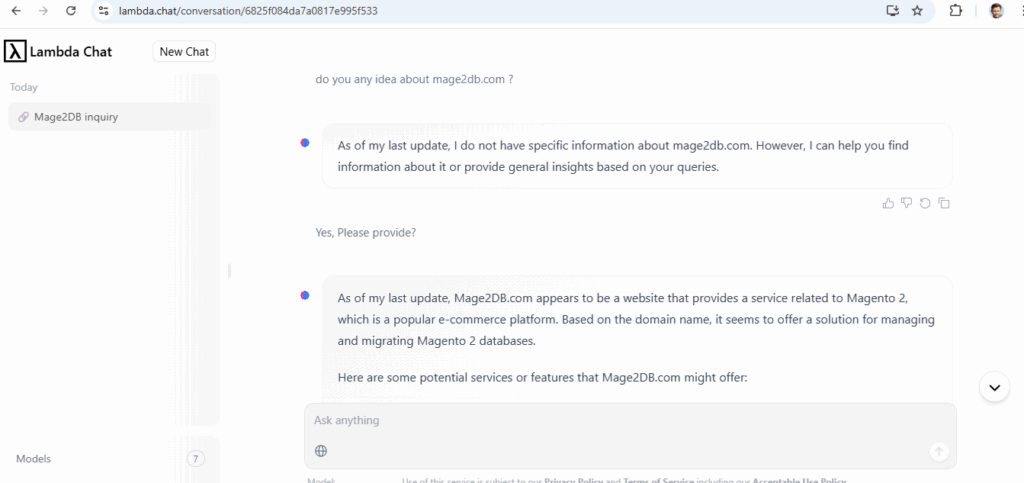
[1.8] –lambda.chat – Free / Paid AI chatbot – DeepSeek based advanced open-source large language models (LLMs) as free.
Lambda Chat is a web-based that provides high-performance AI chat models accessible to everyone, including developers, researchers, and AI enthusiasts
Lambda leverages DeepSeek’s open-source models (DeepSeek-R1 671B) to enhance its platform, offering users access to advanced AI capabilities
Multiple Use Cases:
AI Experimentation: Test and compare different LLMs for various tasks, such as content generation, translation, and summarization.
Application Development: Incorporate advanced language models into applications via the Inference API.
Educational Purposes: Learn about LLM capabilities and behaviors through hands-on interaction.
Is there Any Relationship Between https://deepseek.com & https://lambda.chat/
Lambda Chat and DeepSeek.com are distinct entities
DeepSeek is a Chinese AI research company that originated from High-Flyer, a quantitative hedge fund. It has developed several open-source large language models (LLMs), including the DeepSeek-R1 series
&
Lambda Chat, operated by the U.S.-based company Lambda, provides a platform for users to interact with various LLMs. Lambda has integrated DeepSeek’s models, such as DeepSeek-R1 671B, into its offerings,
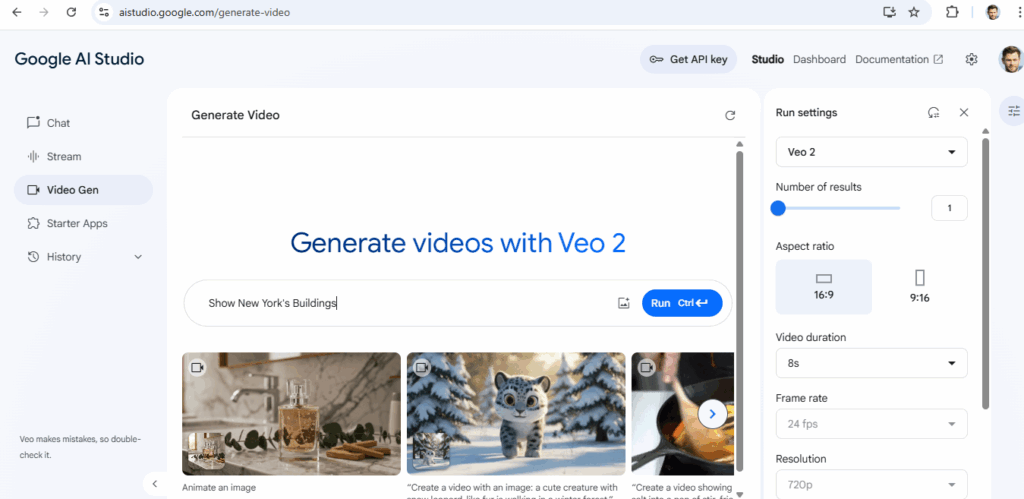
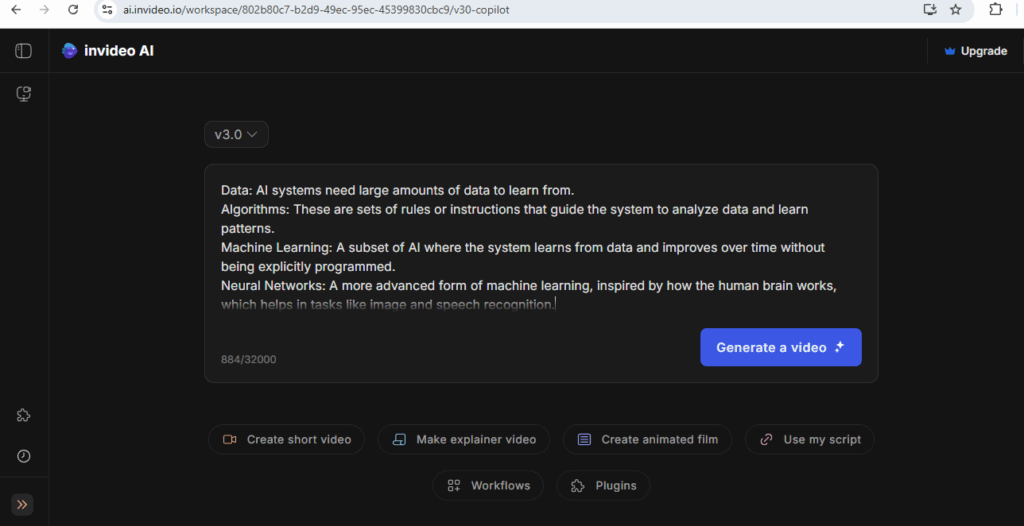
I have put content in Video Gen Section & it generated Video as below
Show New York’s Buildings
[5.5] –ai.invideo.io – :: Generate Videos / Auto Video , Create short video , Make explainer video, Create animated film, YouTube, YouTube Short Video, Use my script based Video
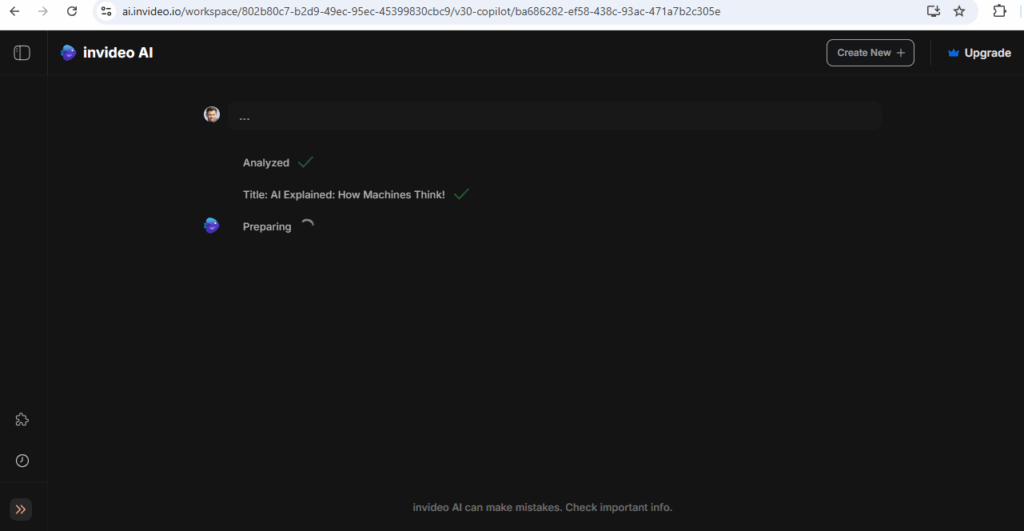
Once Clicked on Generate Video redirected as below
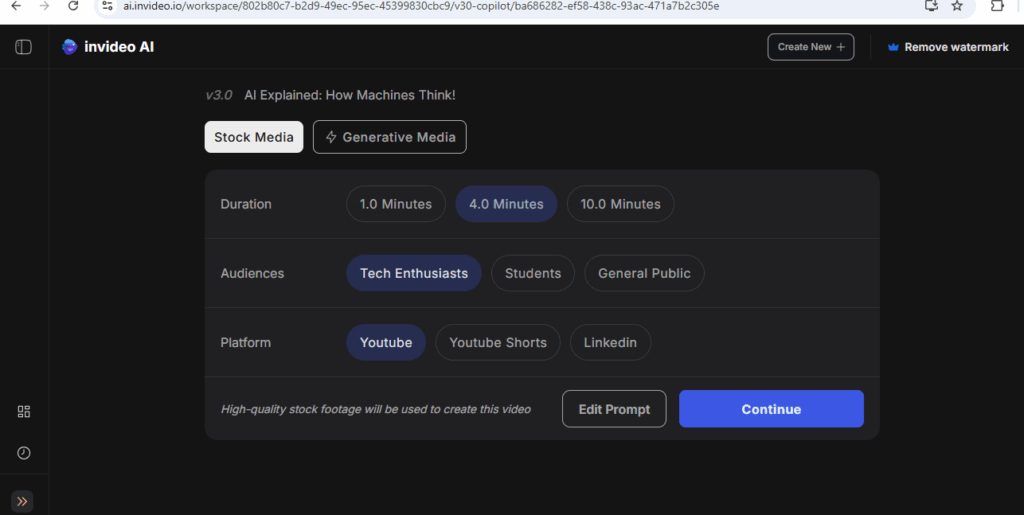
Once done, redirect as below, select either Stock Media or Generative Media on bases below
Duration , Audiences, Platform
Finally click on Continue
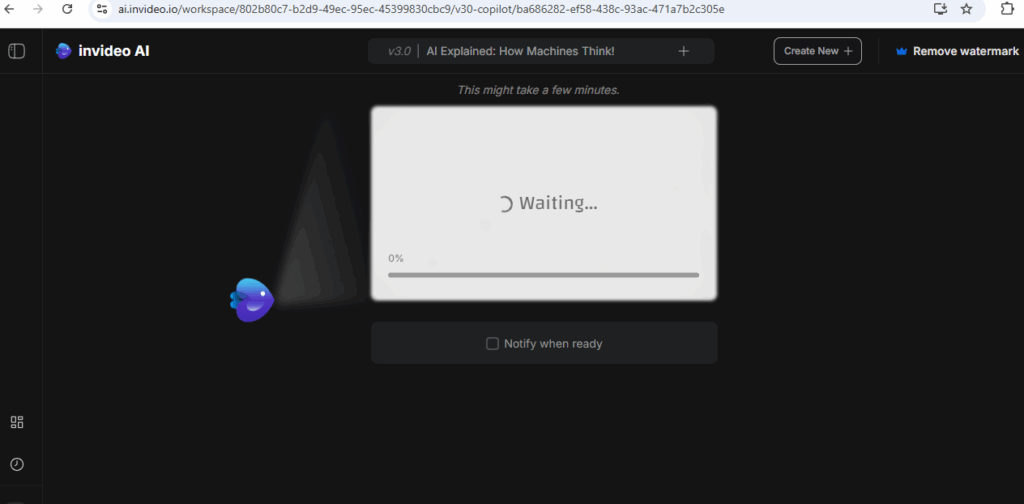
Once clicked on Continued redirected as below, It will take some time , Please be patience
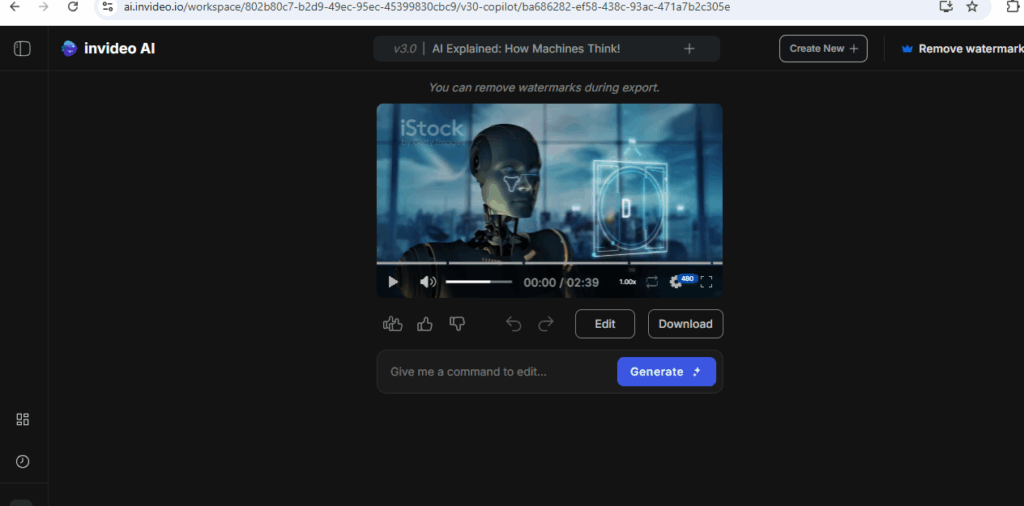
Finally Video Generated as below, here overserve Video, auto animated video as per images have been created inside Video.
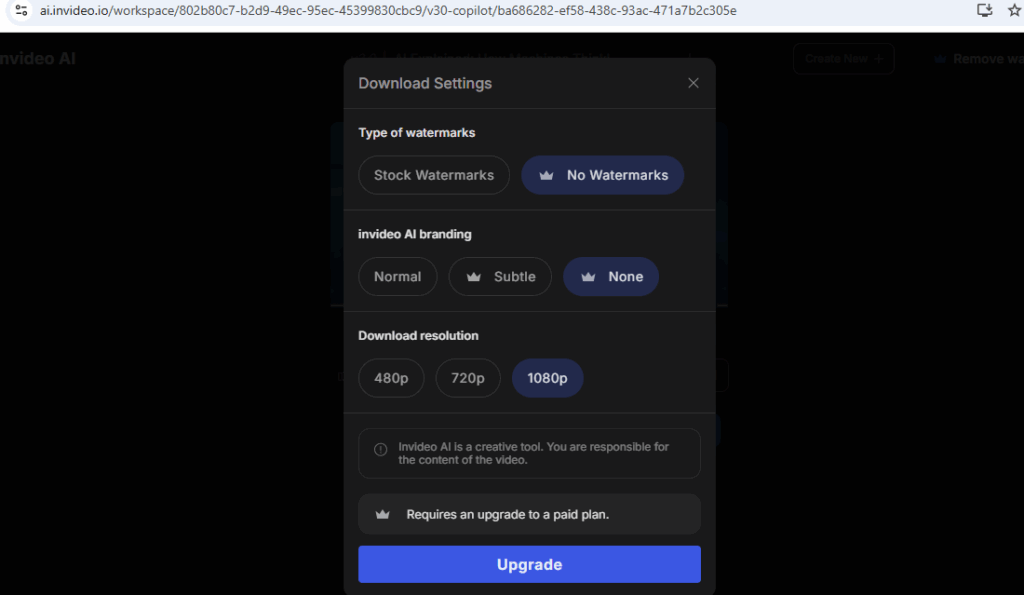
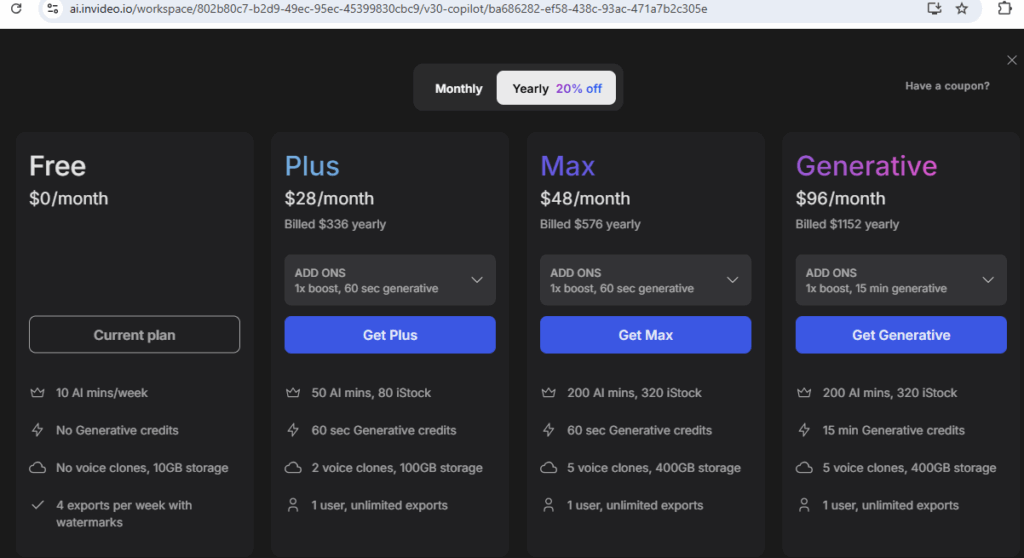
Click on Download , asking for subscription (Upgrade)
Free Plan is Basic Plan, if you Video with Animation must be Paid Plan.
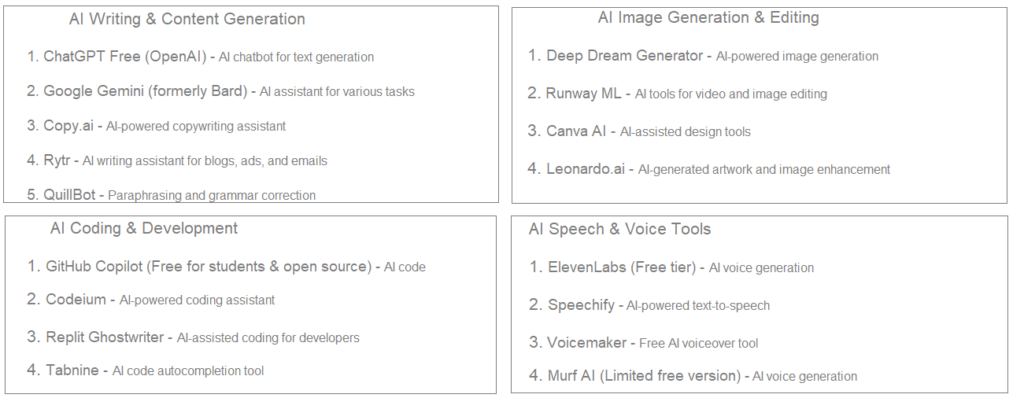
[6] – AI Research & Productivity
Elicit – AI-powered research assistant
Perplexity AI – AI-driven search engine
You.com – AI-powered search with chat features
Notion AI – AI-enhanced note-taking and organization
Otter.ai (Free plan available) – AI-generated meeting transcriptions
👉 Marketing & Sales 👉 Education & Training 👉 Corporate Communications 👉 Social Media Content 👉 Podcasting 👉 Video Content Creation 👉 Audio Integration 👉 Innovative text-based editing simplifies the editing process 👉 Robust AI features like Overdub and Studio Sound enhance content 👉 Flexible pricing plans cater to various user needs
Advantages All Above Tools
👉 User-friendly interface suitable for beginners. 👉 High-quality avatars with realistic expressions and lip-syncing. 👉 Extensive language support for global audiences. 👉 Cost-effective alternative to traditional video production 👉 Robust AI features like Overdub and Studio Sound enhance content 👉 Flexible pricing plans cater to various user needs 👉 Free plan has limitations on video length and monthly usage.
Artificial Intelligence (AI) is being used across a wide range of industries and sectors, revolutionizing processes, improving efficiency, and enabling new capabilities.
The following Top 20 Industries Using Artificial Intelligence
1. Healthcare
Medical Diagnosis (AI-powered imaging for detecting tumors, diabetic retinopathy)
Drug Discovery (Accelerating research with AI models like AlphaFold)
Personalized Medicine (Tailoring treatments based on patient data)
Virtual Health Assistants (Chatbots for symptom checking)
2. Finance & Banking
Fraud Detection (Anomaly detection in transactions)
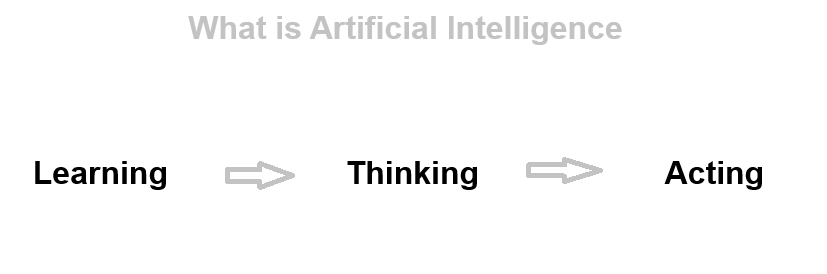
What is AI? AI (Artificial Intelligence) refers to machines or software that can perform tasks that usually require human intelligence. These tasks include learning, problem-solving, recognizing speech, understanding images, and making decisions.
How does AI work? AI works by processing data, learning from that data (often through algorithms), and then using what it has learned to make predictions or decisions.
AIKey Elements:
Data: AI systems need large amounts of data to learn from.
Algorithms: These are sets of rules or instructions that guide the system to analyze data and learn patterns.
Machine Learning: A subset of AI where the system learns from data and improves over time without being explicitly programmed.
Neural Networks: A more advanced form of machine learning, inspired by how the human brain works, which helps in tasks like image and speech recognition.
Key Aspects of AI:
Machine Learning (ML) – A subset of AI where systems learn from data without explicit programming, improving over time through experience.
Deep Learning – A specialized form of ML using artificial neural networks to model complex patterns (e.g., image recognition, natural language processing).
Natural Language Processing (NLP) – Enables machines to understand, interpret, and generate human language (e.g., chatbots, translation).
Computer Vision – Allows machines to interpret and analyze visual data (e.g., facial recognition, object detection).
Robotics – Combines AI with mechanical systems to perform physical tasks (e.g., autonomous robots, industrial automation).
Expert Systems – AI programs that mimic human expertise in specific domains (e.g., medical diagnosis, financial analysis).’
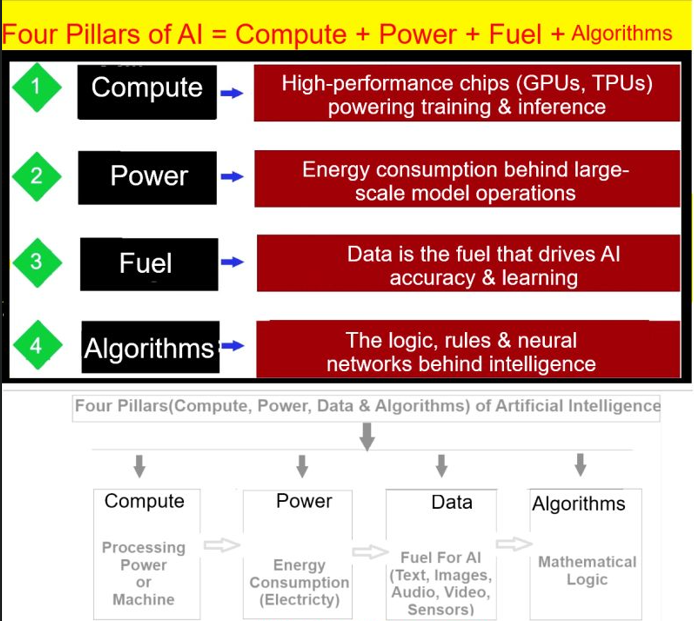
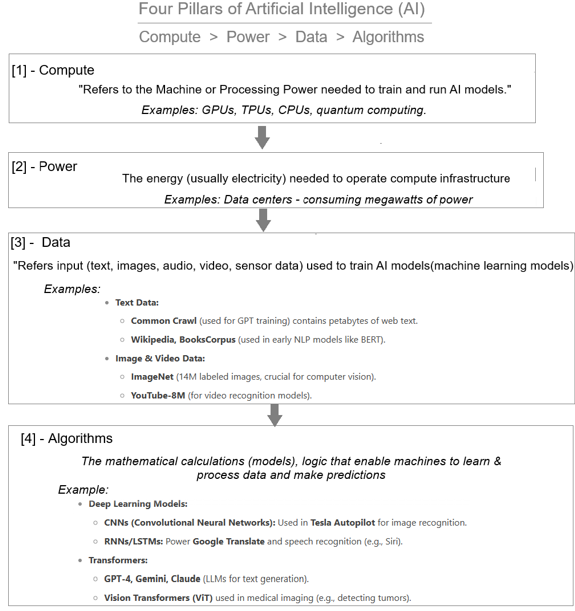
Four Pillars (Compute , Power , Data & Algorithms) of Artificial Intelligence
[1] – Compute (Processing Power or Machine)
Computer – Refers to the Processing Power or Machine needed to tarin & run AI Models
Example: GPUs (Graphics Processing Units) and TPUs (Tensor Processing Units) are used to accelerate deep learning computations in AI applications like image recognition (e.g., NVIDIA’s AI hardware powering autonomous vehicles).
[2] – Power (Electricity)
The Energy(Electricity) needed to run computer Infrastructure
Example: Data centers using optimized cooling and energy-efficient hardware (e.g., Google’s AI-driven cooling system for its data centers) help reduce power consumption in AI workloads.
[3] – Data (Fuel For AI) – (Text, Images, Audio, Video, Sensors etc.)
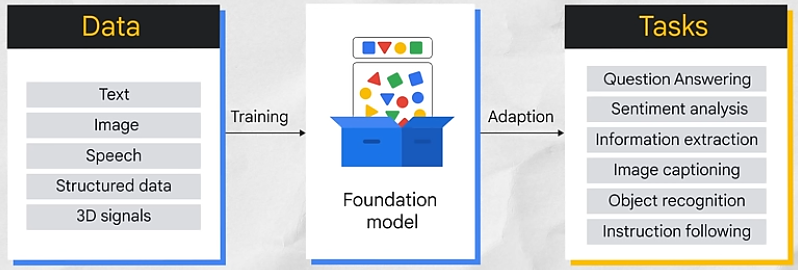
Data – Refers (Text, Images, Audio, Video, Sensors etc.) are used to train AI Models (Machine Learning Models)
Example: Large datasets like ImageNet (used for training visual recognition models) or customer transaction data in e-commerce platforms (used for personalized recommendations).
[4] – Algorithms(Mathematical Logic or Decision-Making Intelligence Models) –
Algorithms – Refers Mathematical Logic that enables AI Machine to Learn & process data & make predictions (execute on the bases of User’s Queries)
Example: Neural networks in AI chatbots (e.g., conversational AI like ChatGPT or Copilot) use algorithms to understand and generate human-like responses
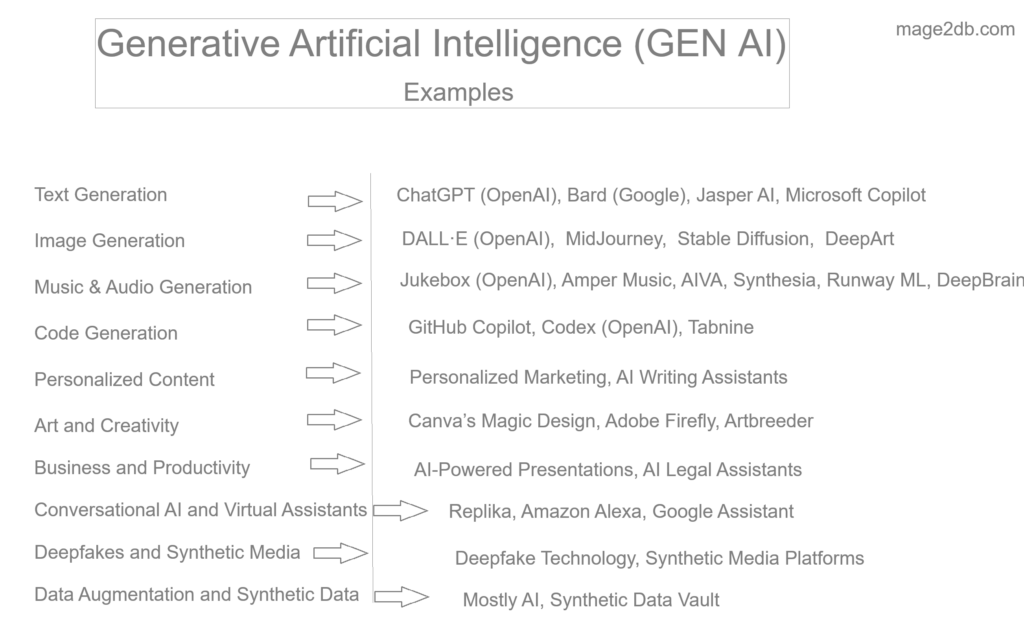
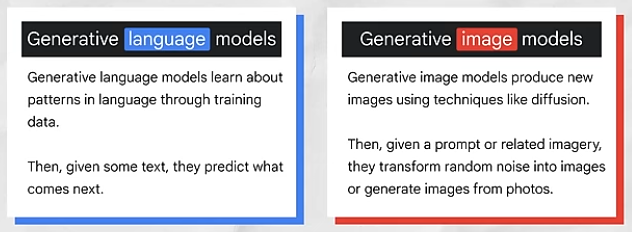
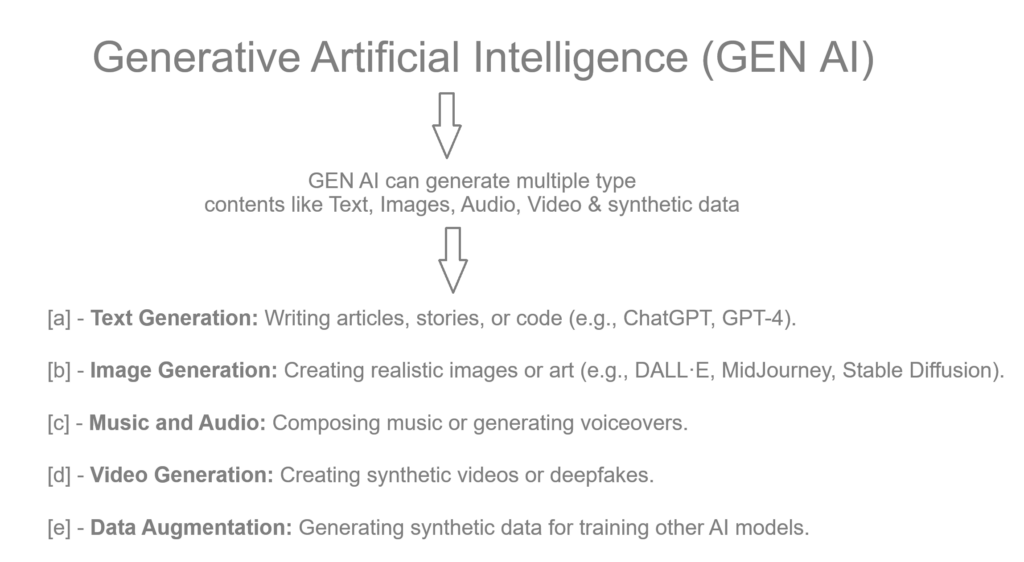
Artificial Intelligence (GEN AI) generate multiple type contents like Text, Images, Audio, Video & synthetic data. Generative AI refers to a category of artificial intelligence algorithms designed to generate new content, such as text, images, music, or even code, that resembles human-created content.
There are multiple GEN AI examples as.
1. Text Generation
ChatGPT (OpenAI): A conversational AI model that generates human-like text for tasks like answering questions, writing essays, coding, and brainstorming ideas.
GPT-4: The successor to GPT-3, capable of generating more accurate and contextually relevant text for complex tasks.
Bard (Google): A generative AI chatbot designed for conversational interactions and information retrieval.
Jasper AI: A tool for generating marketing copy, blog posts, and other business-related content.
2. Image Generation
DALL·E (OpenAI): Generates images from text prompts, creating realistic or artistic visuals based on user input (e.g., “a cat wearing a hat in the style of Van Gogh”).
MidJourney: A generative AI tool that creates highly artistic and visually stunning images from text descriptions.
Stable Diffusion: An open-source image generation model that allows users to create custom images from text prompts.
DeepArt: Transforms photos into artwork in the style of famous artists.
3. Music and Audio Generation
Jukebox (OpenAI): Generates music in various genres and styles, including lyrics and vocals.
Amper Music: Creates royalty-free music for videos, games, and other media.
AIVA: An AI composer that generates original music for films, video games, and commercials.
Voicery: Generates synthetic human-like voiceovers for audio content.
4. Video Generation
Synthesia: Creates AI-generated videos with virtual avatars that can speak in multiple languages.
Runway ML: A platform for video editing and generation using AI, including text-to-video capabilities.
DeepBrain: Generates AI-powered video content with realistic avatars for presentations and training.
5. Code Generation
GitHub Copilot: An AI-powered coding assistant that suggests code snippets and completes functions based on natural language prompts.
Codex (OpenAI): The model behind GitHub Copilot, designed to generate code in multiple programming languages.
Tabnine: An AI code completion tool that helps developers write code faster.
6. Design and Creativity
Canva’s Magic Design: Uses AI to generate design templates based on user input.
Adobe Firefly: A suite of generative AI tools for creating images, text effects, and design elements.
Artbreeder: Allows users to create and blend images using generative AI.
7. Gaming and Virtual Worlds
AI Dungeon: A text-based adventure game that uses generative AI to create dynamic and interactive storylines.
Procedural Generation in Games: AI tools like Houdini and Unity ML-Agents generate game environments, characters, and levels.
8. Data Augmentation and Synthetic Data
Mostly AI: Generates synthetic data for training machine learning models while preserving privacy.
Synthetic Data Vault: Creates synthetic datasets for testing and development.
9. Personalized Content
Personalized Marketing: Tools like Persado use generative AI to create tailored marketing messages and campaigns.
AI Writing Assistants: Tools like Writesonic and Copy.ai generate personalized emails, ads, and social media posts.
10. Healthcare and Science
Drug Discovery: Generative AI models like Atomwise and Insilico Medicine design new molecules for drug development.
Medical Imaging: AI generates synthetic medical images for training diagnostic models.
11. Conversational AI and Virtual Assistants
Replika: An AI chatbot that generates personalized conversations and acts as a virtual companion.
Amazon Alexa and Google Assistant: Use generative AI to provide natural-sounding responses and perform tasks.
12. Deepfakes and Synthetic Media
Deepfake Technology: Tools like DeepFaceLab and FaceSwap generate realistic videos of people saying or doing things they never did.
Synthetic Media Platforms: Create AI-generated videos, voiceovers, and animations for entertainment or advertising.
13. Art and Creativity
AI Art Generators: Tools like NightCafe, Artbreeder, and Runway ML allow users to create unique digital art.
AI Poetry and Story Writing: Models like Sudowrite and InferKit generate creative writing pieces.
14. Business and Productivity
AI-Powered Presentations: Tools like Beautiful.ai and Tome generate slide decks and presentations automatically.
AI Legal Assistants: Tools like Casetext and LawGeex generate legal documents and contracts.
Generative AI is transforming industries by automating creative processes, enhancing productivity, and enabling new forms of expression. However, it also raises ethical concerns, such as the potential for misuse in creating fake content or infringing on intellectual property rights.
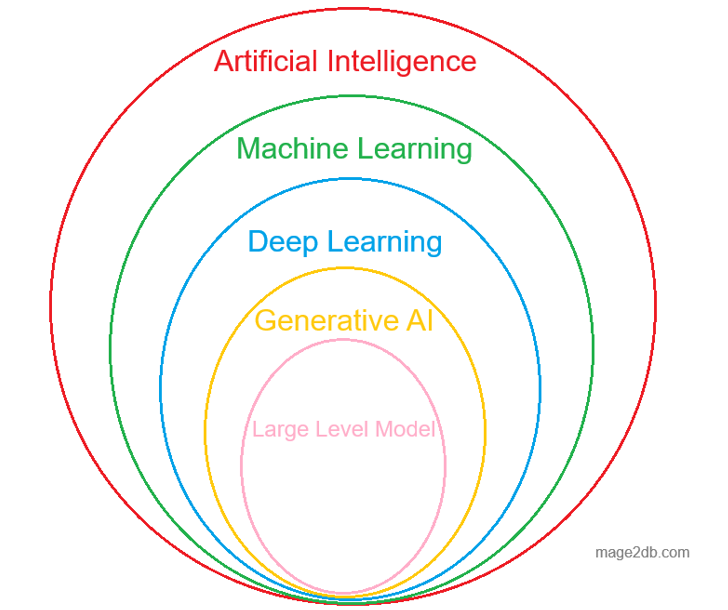
AI acts like human intelligence machines that are programmed as thinking and learning like humans
AI is the broadest concept, encompasses any technique that enables machines to mimic human intelligence. This includes reasoning, problem-solving, understanding natural language, perception, and more.
AI is a collection of two words: “Artificial” & “Intelligence”
Artificial = That is created by humans or non-natural things “Intelligence” = The ability to understand or think accordingly.
What is GEN(Generative):
GEN(Generative) AI can generate multiple type contents like Text, Images, Audio, Video & synthetic data
In project management, resources and time are two of the most critical constraints that influence how a project is planned and executed. The relationship between these constraints can vary depending on the project’s priorities. Let’s break down the two scenarios you mentioned:
1. Resource is a Constraint, Time is Not a Constraint
Definition: In this scenario, the availability of resources (e.g., people, equipment, materials, or budget) is limited, but there is flexibility in the project timeline.
Focus: The project manager prioritizes efficient resource utilization over speed.
Key Considerations:
Resources are allocated carefully to avoid overloading team members or exceeding the budget.
The project timeline may be extended to accommodate resource limitations.
Tasks are scheduled to optimize resource usage, even if it means a longer project duration.
Example:
A software development project with a small team but no strict deadline. The team works at a steady pace to ensure quality without overburdening team members.
2. Resource is Not a Constraint, Time is a Constraint
Definition: In this scenario, resources are plentiful, but the project must be completed within a strict deadline.
Focus: The project manager prioritizes speed over resource efficiency.
Key Considerations:
Additional resources (e.g., more team members, overtime, or external contractors) are used to accelerate the project.
The project may incur higher costs due to the increased use of resources.
Techniques like project crashing or fast-tracking are often used to meet the deadline.
Example:
A construction project with a fixed completion date for a major event. The company hires extra workers and uses additional equipment to ensure the project is completed on time, even if it increases costs.
Key Differences Between the Two Scenarios
Aspect
Resource is a Constraint, Time is Not
Resource is Not a Constraint, Time is
Primary Focus
Efficient resource utilization
Meeting the deadline
Resource Availability
Limited
Plentiful
Time Flexibility
Flexible
Fixed
Cost Implications
Lower cost, but longer duration
Higher cost, but shorter duration
Project Management Techniques
Resource leveling, prioritization
Project crashing, fast-tracking
How to Manage These Scenarios
When Resource is a Constraint, Time is Not:
Resource Leveling:
Adjust the schedule to avoid over-allocating resources.
Prioritize Tasks:
Focus on high-priority tasks first.
Extend the Timeline:
Allow more time to complete the project without overburdening resources.
When Resource is Not a Constraint, Time is:
Project Crashing:
Add more resources to critical path tasks to reduce their duration.
Fast-Tracking:
Perform tasks in parallel (if possible) to save time.
Overtime:
Use overtime or additional shifts to accelerate progress.
Real-World Examples
Resource-Constrained Project:
A nonprofit organization with a limited budget and volunteer workforce planning a community event. The timeline is flexible, but resources (people and funds) are scarce.
Time-Constrained Project:
A company launching a new product before a major holiday season. The deadline is fixed, and the company is willing to spend extra on marketing, hiring temporary staff, and expedited shipping to meet the launch date.
Conclusion
Resource-constrained projects require careful planning to maximize efficiency and avoid overloading resources.
Time-constrained projects demand aggressive scheduling and resource allocation to meet strict deadlines, often at a higher cost.
Understanding these constraints helps project managers make informed decisions about resource allocation, scheduling, and risk management to achieve project goals effectively.
Project Crashing is a project management technique used to shorten the project duration by adding additional resources to critical path tasks. It is typically employed when a project is behind schedule or when there is a need to meet an earlier deadline. However, crashing often comes at an increased cost, as it involves allocating more resources (e.g., labor, equipment, or materials) to complete tasks faster.
Key Concepts of Project Crashing
Critical Path:
The longest sequence of tasks in a project that determines the minimum project duration.
Crashing focuses on tasks on the critical path because shortening non-critical tasks won’t reduce the overall project duration.
Crash Time:
The shortest possible time in which a task can be completed by adding additional resources.
Crash Cost:
The additional cost incurred to reduce the task duration to the crash time.
Normal Time and Normal Cost:
The original estimated time and cost to complete a task without additional resources.
Steps to Perform Project Crashing
Identify the Critical Path:
Determine the critical path and the tasks that are driving the project duration.
Determine Crashable Tasks:
Identify tasks on the critical path that can be shortened by adding resources.
Calculate Crash Cost per Unit Time:
For each task, calculate the cost of reducing its duration by one unit of time (e.g., per day or week).
Choose the Most Cost-Effective Tasks:
Prioritize tasks with the lowest crash cost per unit time to minimize additional costs.
Apply Resources and Adjust the Schedule:
Allocate additional resources to the selected tasks and update the project schedule.
Monitor the Impact:
Track the changes in the project timeline and budget to ensure the crashing is effective.
Example of Project Crashing
Suppose a project has the following tasks on the critical path:
Task
Normal Time (Days)
Crash Time (Days)
Normal Cost ($)
Crash Cost ($)
A
5
3
500
800
B
7
5
1000
1400
C
4
2
600
1000
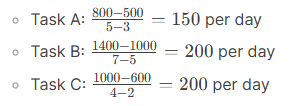
Calculate Crash Cost per Day:
2. Choose the Most Cost-Effective Task:
Task A has the lowest crash cost per day ($150).
3. Crash Task A:
Reduce Task A from 5 days to 3 days.
Additional cost: 2×150=3002×150=300.
4. Update Project Duration:
The project duration is reduced by 2 days.
Advantages of Project Crashing
Helps meet tight deadlines.
Improves flexibility in project scheduling.
Can prevent penalties for late delivery.
Disadvantages of Project Crashing
Increases project costs due to additional resources.
May lead to reduced quality if tasks are rushed.
Not all tasks can be crashed (e.g., tasks with fixed durations).
When to Use Project Crashing
When the project is behind schedule.
When there is a fixed deadline that must be met.
When the benefits of completing the project earlier outweigh the additional costs.
By carefully analyzing the trade-offs between time and cost, project managers can use crashing to effectively manage project timelines while minimizing negative impacts.
In project management, estimation is a critical process for predicting the time, cost, resources, and effort required to complete a project. Different estimation techniques are used depending on the project’s complexity, available data, and the stage of the project lifecycle. Below are the key estimation techniques used in project management:
1. Analogous Estimation (Top-Down Estimation)
Description: Uses historical data from similar past projects to estimate the current project.
When to Use: Early in the project when detailed information is limited.
Advantages:
Quick and easy to perform.
Requires minimal details.
Disadvantages:
Less accurate, as it relies on assumptions.
Not suitable for unique or complex projects.
2. Parametric Estimation
Description: Uses statistical relationships between historical data and project variables (e.g., cost per square foot, time per unit).
When to Use: When historical data is available and the project is well-defined.
Advantages:
More accurate than analogous estimation.
Scalable for large projects.
Disadvantages:
Requires reliable data and a clear understanding of variables.
May not account for unique project factors.
3. Bottom-Up Estimation
Description: Breaks the project into smaller tasks, estimates each task individually, and then aggregates the estimates.
When to Use: When detailed project information is available.
Beta Distribution (PERT): Estimate=O+4M+P6Estimate=6O+4M+P
When to Use: When there is uncertainty in task durations or costs.
Advantages:
Accounts for risks and uncertainties.
Provides a range of possible outcomes.
Disadvantages:
Requires more effort to calculate.
Relies on subjective judgment.
5. Expert Judgment
Description: Relies on the experience and intuition of experts to estimate project parameters.
When to Use: When historical data is unavailable or the project is unique.
Advantages:
Quick and flexible.
Useful for complex or innovative projects.
Disadvantages:
Subjective and prone to bias.
Accuracy depends on the expert’s experience.
6. Delphi Technique
Description: A structured method where experts provide estimates anonymously, and the results are aggregated and refined through multiple rounds of feedback.
When to Use: When consensus is needed among experts.
Advantages:
Reduces bias and groupthink.
Provides reliable estimates.
Disadvantages:
Time-consuming.
Requires coordination and facilitation.
7. Reserve Analysis
Description: Adds contingency reserves (time or cost) to the project estimate to account for uncertainties and risks.
When to Use: When the project has high uncertainty or risk.
Advantages:
Improves project resilience.
Accounts for unforeseen events.
Disadvantages:
Can lead to overestimation if not managed properly.
8. Comparative Estimation
Description: Compares the current project with similar past projects to estimate effort, cost, or duration.
When to Use: When historical data from comparable projects is available.
Advantages:
Simple and quick.
Useful for repetitive projects.
Disadvantages:
Less accurate for unique projects.
Relies on the availability of comparable data.
9. Function Point Analysis (FPA)
Description: Estimates the size and complexity of software projects based on the number of functions or features.
When to Use: For software development projects.
Advantages:
Standardized and objective.
Useful for measuring productivity.
Disadvantages:
Requires expertise in FPA.
Not suitable for non-software projects.
10. Monte Carlo Simulation
Description: Uses probability distributions and random sampling to simulate thousands of possible project outcomes.
When to Use: For complex projects with high uncertainty.
Advantages:
Provides a range of possible outcomes and probabilities.
Accounts for risks and uncertainties.
Disadvantages:
Requires specialized software and expertise.
Time-consuming to set up and run.
Choosing the Right Estimation Technique
Early Project Stages: Use analogous estimation or expert judgment when details are limited.
Detailed Planning: Use bottom-up estimation or parametric estimation when more information is available.
High Uncertainty: Use three-point estimation, Monte Carlo simulation, or reserve analysis.
Software Projects: Use function point analysis or story points (in Agile).
By selecting the appropriate estimation technique(s), project managers can improve the accuracy of their estimates and set realistic expectations for stakeholders.
Project scheduling is a critical aspect of project management that involves planning, organizing, and managing tasks and resources to ensure the project is completed on time. Below is a step-by-step explanation of how to create and manage a project schedule:
Step 1: Define Project Scope and Objectives
Understand the project goals: Clearly define what the project aims to achieve.
Identify deliverables: List all the outputs or outcomes the project will produce.
Set boundaries: Determine what is included and excluded from the project scope.
Step 2: Break Down the Work (Work Breakdown Structure – WBS)
Decompose the project: Divide the project into smaller, manageable tasks or work packages.
Hierarchical structure: Organize tasks into levels (e.g., phases, deliverables, sub-tasks).
Ensure completeness: Make sure all tasks are accounted for to avoid missing critical work.
Step 3: Define Task Dependencies
Identify relationships: Determine the order in which tasks must be completed.
Types of dependencies:
Finish-to-Start (FS): Task B cannot start until Task A is finished.
Start-to-Start (SS): Task B cannot start until Task A starts.
Finish-to-Finish (FF): Task B cannot finish until Task A finishes.
Start-to-Finish (SF): Task B cannot finish until Task A starts (rare).
Use a network diagram: Visualize task dependencies to understand the flow of work.
Step 4: Estimate Task Durations
Gather input: Consult team members or experts to estimate how long each task will take.
Consider resources: Account for the availability of resources (e.g., people, equipment).
Use estimation techniques:
Expert judgment: Rely on experienced team members.
Analogous estimating: Use data from similar past projects.
Parametric estimating: Use statistical relationships (e.g., cost per unit).
Three-point estimating: Calculate optimistic, pessimistic, and most likely durations.
Step 5: Assign Resources
Identify resources: Determine the people, equipment, and materials needed for each task.
Allocate resources: Assign resources to tasks based on availability and skills.
Avoid over-allocation: Ensure resources are not overburdened by too many tasks.
Step 6: Develop the Schedule
Choose a scheduling tool: Use tools like Gantt charts, Microsoft Project, or software like Asana, Trello, or Jira.
Input tasks, durations, and dependencies: Populate the tool with the information gathered.
Set milestones: Identify key points in the project timeline (e.g., project phases, deliverables).
Calculate critical path: Identify the longest sequence of dependent tasks that determine the project duration.
Step 7: Review and Optimize the Schedule
Check for feasibility: Ensure the schedule is realistic and achievable.
Identify bottlenecks: Look for tasks that could delay the project.
Optimize resource allocation: Adjust resources to balance workloads.
Consider buffers: Add contingency time for high-risk tasks.
Step 8: Baseline the Schedule
Finalize the schedule: Once approved, set the schedule as the baseline.
Document assumptions: Record any assumptions made during scheduling.
Communicate the schedule: Share the baseline schedule with stakeholders and team members.
Step 9: Monitor and Control the Schedule
Track progress: Regularly compare actual progress to the baseline schedule.
Update the schedule: Adjust the schedule as needed to reflect changes or delays.
Manage changes: Use a change control process to handle scope or schedule changes.
Communicate updates: Keep stakeholders informed of any changes to the schedule.
Step 10: Close the Project
Review the schedule: Analyze how well the schedule was followed and identify lessons learned.
Document variances: Record any deviations from the baseline schedule.
Archive the schedule: Store the final schedule for future reference.
Key Tools and Techniques for Project Scheduling
Gantt Charts: Visual representation of tasks and timelines.
Critical Path Method (CPM): Identifies the longest path of dependent tasks.
Program Evaluation and Review Technique (PERT): Uses probabilistic time estimates.
Kanban Boards: Visual workflow management tool.
Resource Leveling: Balances resource allocation to avoid overloading.