
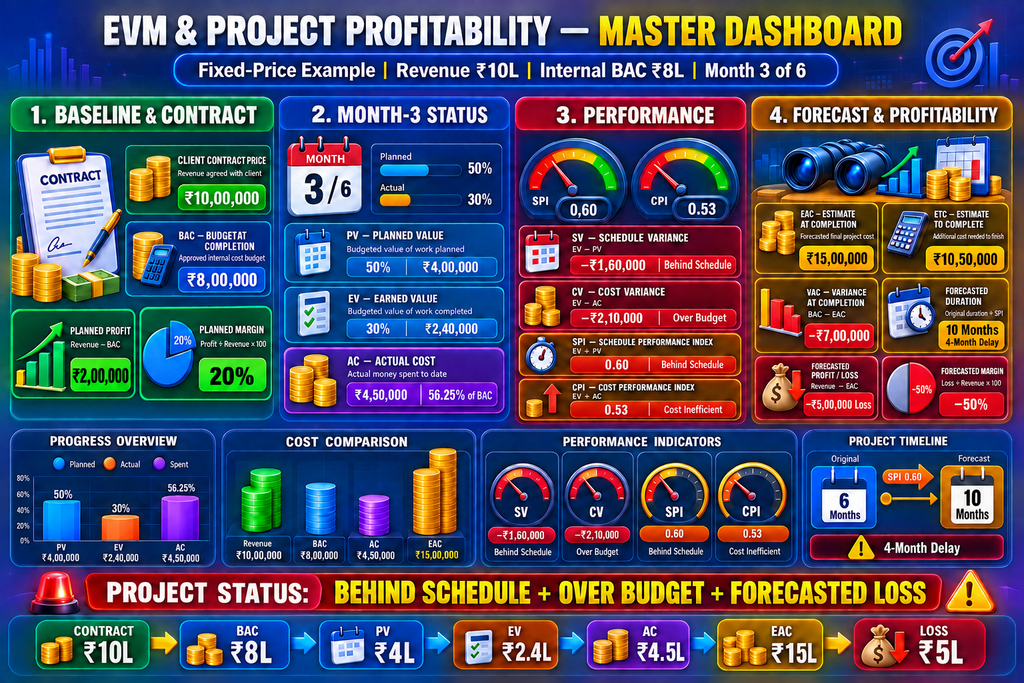
Fixed‑Price Project Profitability and EVM Analysis
₹10 Contract Price vs ₹8 Lakh Cost Budget
“Contract Price or Client Billing Value, Project Revenue or Commercial Value – “-The amount the client agrees to pay under the signed contract.
“Budget at Completion (BAC) or Approved Project Cost Budget or Internal Delivery Budget or Cost Baseline – “The internal cost ceiling approved for delivering the project.
Table of Contents
- 1. Project Scenario
- 2. Contract Revenue and Cost Budget
- 3. Budget at Completion (BAC)
- 4. Monthly Planned Checkpoints
- 5. Month‑3 Performance Position
- 6. Planned Value (PV)
- 7. Earned Value (EV)
- 8. Actual Cost (AC)
- 9. EVM Summary at Month‑3
- 10. Schedule Variance (SV)
- 11. Schedule Performance Index (SPI)
- 12. Cost Variance (CV)
- 13. Cost Performance Index (CPI)
- 14. Complete Month‑3 Health Check
- 15. Forecasted Final Cost (EAC)
- 16. Estimate to Complete (ETC)
- 17. Variance at Completion (VAC)
- 18. Forecasted Project Duration
- 19. Planned Profitability
- 20. Forecasted Profit or Loss
- 21. Forecasted Profit Margin
- 22. Planned vs Forecasted Commercial Position
- 23. Why a Profitable Project Can Become Loss‑Making
- 24. Monthly Management Checkpoints
- 25. Recommended Recovery Plan
- 26. Client Report vs Internal Report
- 27. Common Calculation Mistakes
- 28. Final Project Summary
- 29. Final Conclusion
1 – Project Scenario
Fixed-price software project with ₹10 lakh revenue, ₹8 lakh cost budget, planned profit ₹2 lakh, and 6-month duration.
A software company signs a fixed-price project worth ₹10,00,000 with a planned duration of six months. The company approves an internal delivery-cost budget (BAC) of ₹8,00,000, expecting to earn a ₹2,00,000 profit with a 20% margin. At the end of Month 3, the project should be 50% complete, but only 30% has been completed. Meanwhile, the company has already spent ₹4,50,000—equivalent to 56.25% of its internal cost budget.
2 – Contract Price and Cost Budget
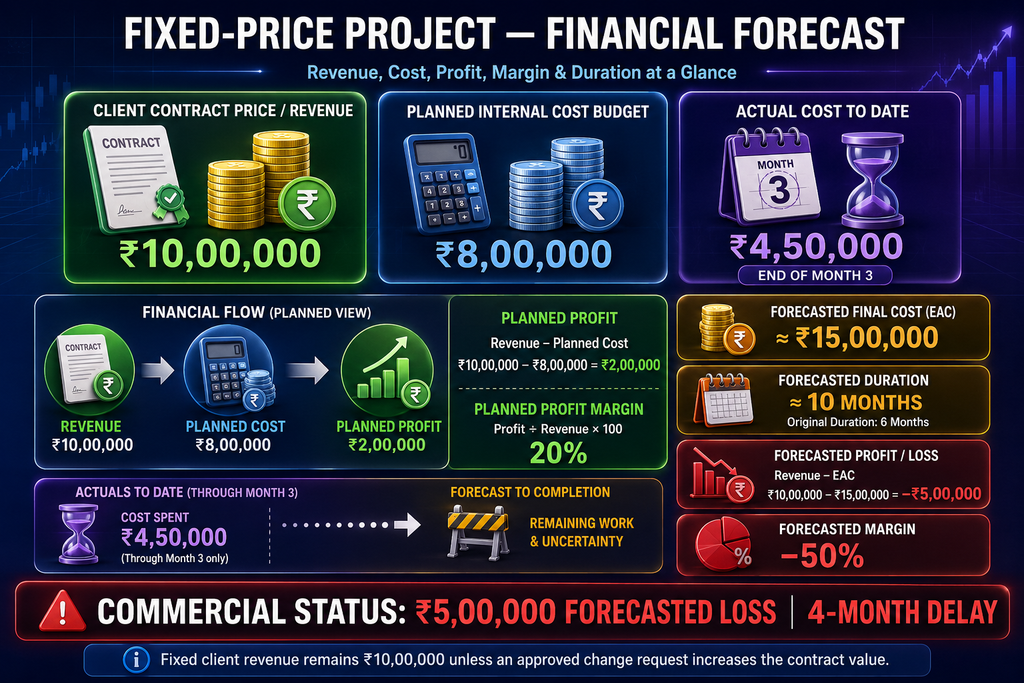
Contract Price: ₹10,00,000
BAC: ₹8,00,000
Planned profit: ₹2,00,000 (20% margin).
3 – Budget at Completion (BAC)
BAC is the approved internal cost baseline (₹8 lakh). It is not revenue or profit.
4 – Monthly Planned Checkpoints
Progress evenly distributed across 6 months: 16.7%, 33.3%, 50%, 66.7%, 83.3%, 100%.
5 – Month‑3 Performance Position
Planned 50% vs actual 30%. Actual cost ₹4.5 lakh. Behind schedule and over budget.
6 – Planned Value (PV)
PV = BAC × Planned Progress = ₹4,00,000.
7 – Earned Value (EV)
EV = BAC × Actual Progress = ₹2,40,000.
8 – Actual Cost (AC)
AC = ₹4,50,000 (56.25% of BAC consumed).
9 – EVM Summary at Month‑3
BAC: ₹8,00,000 | PV: ₹4,00,000 | EV: ₹2,40,000 | AC: ₹4,50,000.
10 – Schedule Variance (SV)
SV = EV − PV = −₹1,60,000 (behind schedule).
11 – Schedule Performance Index (SPI)
SPI = EV ÷ PV = 0.60 (poor schedule efficiency).
12 – Cost Variance (CV)
CV = EV − AC = −₹2,10,000 (over budget).
13 – Cost Performance Index (CPI)
CPI = EV ÷ AC ≈ 0.53 (poor cost efficiency).
14 – Complete Month‑3 Health Check
30% complete vs 50% planned. 56.25% budget consumed. SPI 0.60, CPI 0.53.
15 – Forecasted Final Cost (EAC)
EAC = BAC ÷ CPI ≈ ₹15,00,000.
16 – Estimate to Complete (ETC)
ETC = EAC − AC = ₹10,50,000.
17 – Variance at Completion (VAC)
VAC = BAC − EAC = −₹7,00,000 (overrun).
18 – Forecasted Project Duration
Forecasted duration = 10 months (4-month delay).
19 – Planned Profitability
At initiation: Revenue ₹10,00,000, Cost budget ₹8,00,000, Profit ₹2,00,000, Margin 20%.
20 – Forecasted Profit or Loss
Forecasted cost ₹15,00,000. Revenue unchanged at ₹10,00,000. Forecasted loss = −₹5,00,000.
21 – Forecasted Profit Margin
Forecasted margin = −50%. Planned margin 20% → deterioration of 70 percentage points.
22 – Planned vs Forecasted Commercial Position
Planned: Profit ₹2,00,000, Margin 20%, Duration 6 months.
Forecasted: Loss ₹5,00,000, Margin −50%, Duration 10 months.
23 – Why a Profitable Project Can Become Loss‑Making
Causes include underestimated effort, scope creep, rework, poor requirements, vendor delays, low productivity, and weak change control.
24 – Monthly Management Checkpoints
Track delivery performance, cost performance (BAC, PV, EV, AC, SV, CV, SPI, CPI, EAC, ETC, VAC), commercial metrics, quality, risks, and recovery actions.
25 – Recommended Recovery Plan
Steps: Validate progress, root‑cause analysis, re‑estimate remaining work, control scope, protect critical activities, reduce rework, review commercial options, reforecast regularly.
26 – Client Report vs Internal Report
Client report: RAG status, milestones, risks, change requests, forecasted delivery.
Internal report: Resource costs, CPI, EAC, VAC, profit/loss, margin deterioration, commercial exposure.
27 – Common Calculation Mistakes
Examples: Using revenue as BAC, miscalculating percentages, using revenue for EV, mixing budget overrun with commercial loss, using rounded CPI for forecasts.
28 – Final Project Summary
At Month 3: 30% complete vs 50% planned, 56.25% budget consumed, SPI 0.60, CPI 0.53, EAC ₹15,00,000, forecasted loss ₹5,00,000, margin −50%, duration 10 months.
29 – Final Conclusion
The project was planned for ₹2 lakh profit at 20% margin but is now forecasted to deliver a ₹5 lakh loss at −50% margin. Lesson: Revenue shows client payment, BAC shows delivery cost, EVM shows efficiency, profitability shows commercial sense.